Guide to Admission Evaluation Criteria with Donut Chart
RM0900013_8
- Last Update 03/04/2025
- File Size 0.3MB
- # of Slides 2
- File Format PPTX
- Slide Ratio 16:9
- Color
Keywords
- #Content-Based Slides
- #Design-Based Slides
- #Market and Competitor Analysis
- #Graph
- #Market Status
- #Market Share
- #Circles
- #Doughnut Chart
- #16:9
- #donut chart PowerPoint slide
- #donut graph presentation template
- #pie chart ratio visualization
- #evaluation criteria PowerPoint
- #how to create donut chart in PowerPoint
About the Product
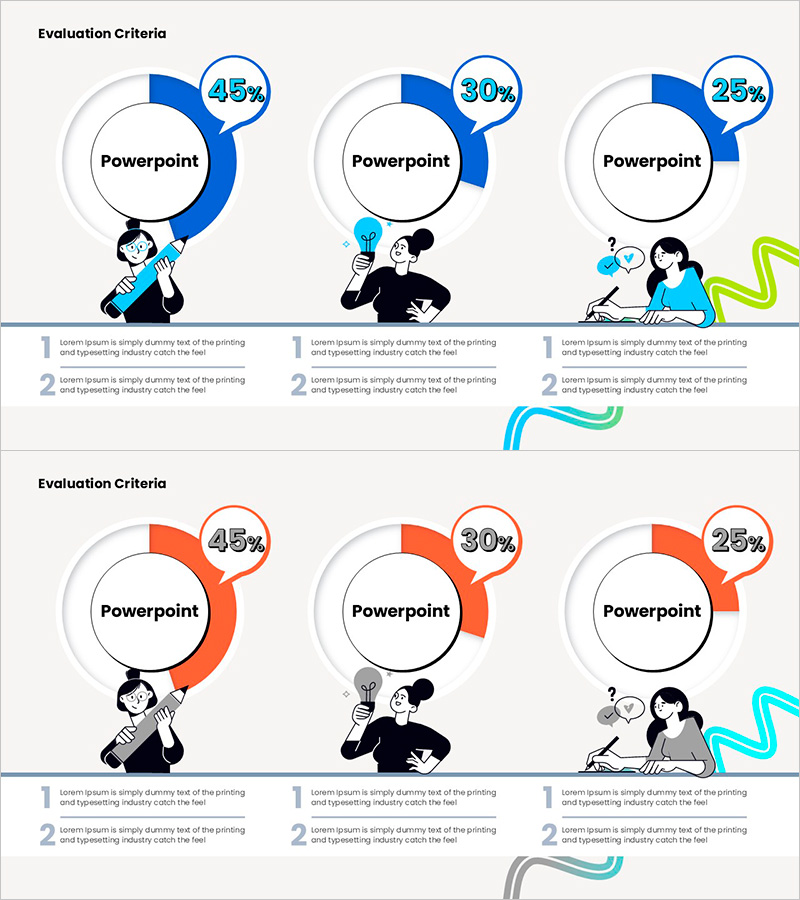
A 2-slide PowerPoint presentation visualizing admission evaluation criteria with a donut chart. The donut graph uses three colors—blue, orange, and gray—to represent evaluation metrics at 45%, 30%, and 25% respectively. Each slide includes descriptive text and character illustrations for immediate presentation use. Provided in 16:9 widescreen PPTX format with fully editable donut chart colors, percentages, and text fields. Perfect for displaying market share, evaluation frameworks, or any three-category ratio data in professional presentations.
Usage Points
-
Main Usage
Ideal for presenting three-category ratio data such as admission evaluation criteria, market share distribution, or market analysis. The 45%-30%-25% structure is designed to visualize institutional assessment metrics, market segmentation, customer satisfaction levels, and comparative data across multiple business contexts.
-
How to Use
Edit the donut chart percentages and labels on slide 1 with your own data values. Modify the evaluation criteria description text on slide 2. To change colors, select each donut segment and adjust the fill color in the formatting menu. Insert into presentations, reports, business proposals, or strategic documents as needed.
-
Recommended For
Education administrators, marketing analysts, business executives, market research professionals, and strategy team members who need to communicate ratio-based data clearly. Particularly effective for presentations emphasizing the relative importance of three key components or categories.
-
Slide Structure
Slide 1: Central donut chart with 3 segments (blue 45%, orange 30%, gray 25%), percentage labels in upper right, 2-line descriptive text below. Slide 2: Donut chart on left side, character illustration and 2-line explanation text on right. 16:9 widescreen format with fully editable text boxes and shape elements.
Related Products
-

Management System Donut Chart Slide – Market Share and Status
#Market and Competitor Analysis #Graph #Market Status
-

Visualizing Fish Market Share with Doughnut Chart – Vitality of the Ocean
#Market and Competitor Analysis #Graph #Market Status
-

Market Share Analysis Graph by Technology – Competition and Collaboration
#Market and Competitor Analysis #Diagram #Graph
-

Logistics Market Share Chart – Current Status and Competitive Analysis
#Market and Competitor Analysis #Graph #Market Status
