Visualizing Fish Market Share with Doughnut Chart – Vitality of the Ocean
RJ0600081_5
- Last Update 07/12/2025
- File Size 1.7MB
- # of Slides 2
- File Format PPTX
- Slide Ratio 16:9
- Color
Keywords
- #Content-Based Slides
- #Design-Based Slides
- #Market and Competitor Analysis
- #Graph
- #Market Status
- #Market Share
- #Circles
- #Doughnut Chart
- #16:9
- #doughnut chart PowerPoint
- #pie chart slide template
- #market share visualization
- #4-segment donut chart
- #data visualization PowerPoint
- #business analytics slide
About the Product
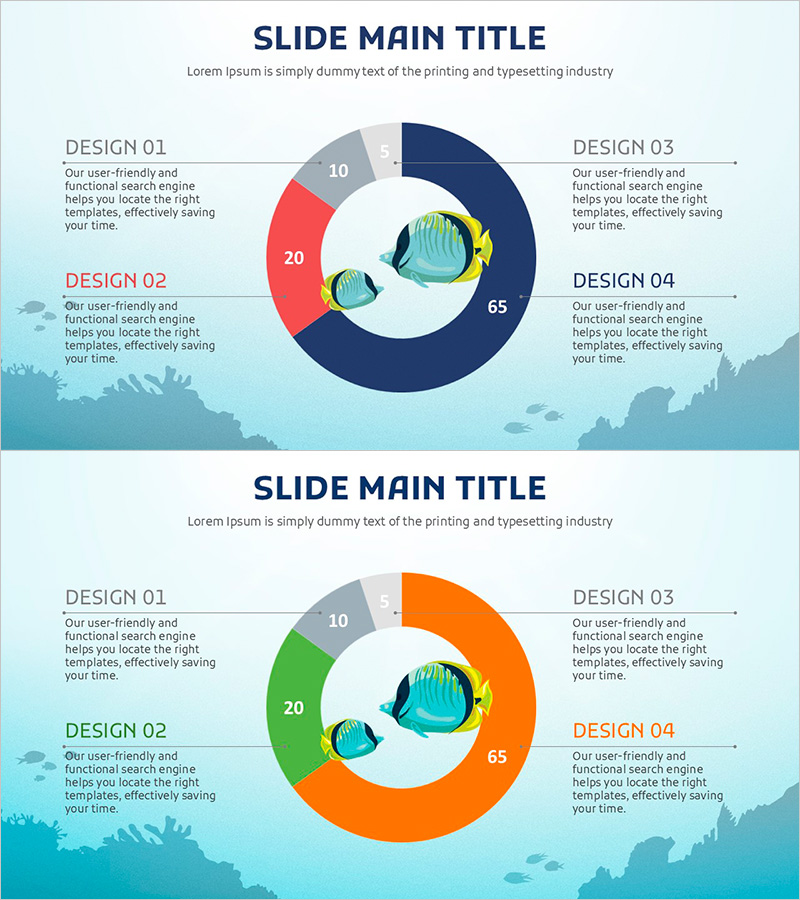
A professional doughnut chart PowerPoint slide visualizing fish market share across four segments with navy, red, green, and gray color coding. The central ocean-themed illustration reinforces the subject matter and draws viewer attention. This 2-slide set includes an alternate version in orange tones for design flexibility. Delivered in 16:9 widescreen PPTX format with fully editable elements, perfect for market analysis presentations, business reports, and investment pitch decks requiring clear data visualization.
Usage Points
-
Main Usage
Clearly visualize four-part ratio data such as market share percentages, sales distribution, customer segments, or product category breakdowns using an intuitive doughnut chart format. The centered illustration emphasizes the marine theme while numerical labels on each segment ensure precise data communication.
-
How to Use
Insert into executive presentations, market analysis reports, or business proposals as your primary data visualization element. Simply replace the chart values and labels with your own data, then select between the navy or orange color version to match your presentation's visual identity and corporate branding.
-
Recommended For
Marketing managers, business analysts, strategic planners, and financial professionals presenting market conditions, sales performance, customer composition, or industry statistics. Ideal for illustrating import/export data, sector market share, or product revenue distribution across multiple categories.
-
Slide Structure
Two-slide template featuring identical doughnut chart layouts in different color schemes. Each slide contains a centered doughnut graph (4 segments with 65, 20, 10, 5 ratio), left and right text zones (DESIGN 01–04 labels), title and subtitle areas at the top, and a cohesive ocean-themed background illustration.
Related Products
-

How to Protect Your Environment Pie Chart
#Market and Competitor Analysis #Graph #Market Status
-

Doughnut Chart Visualizing Proportion of Grain Yields
#Market and Competitor Analysis #Graph #Market Status
-

Market Share Analysis Graph by Technology – Competition and Collaboration
#Market and Competitor Analysis #Diagram #Graph
-

Enrollment Stats & Ratios Donut Chart
#Market and Competitor Analysis #Graph #Market Status
