Market Analysis Table & Circular Graph
RJ0400011_17
- Last Update 05/20/2025
- File Size 0.3MB
- # of Slides 2
- File Format PPTX
- Slide Ratio 16:9
- Color
Keywords
- #Content-Based Slides
- #Design-Based Slides
- #Market and Competitor Analysis
- #Diagram
- #Graph
- #Market Status
- #Table
- #Circles
- #Standard Table
- #Horizontal Table
- #Doughnut Chart
- #16:9
- #donut chart PowerPoint slide
- #pie chart template
- #market analysis table PPT
- #ratio comparison slide
- #circular graph presentation template
- #how to create donut chart in PowerPoint
About the Product
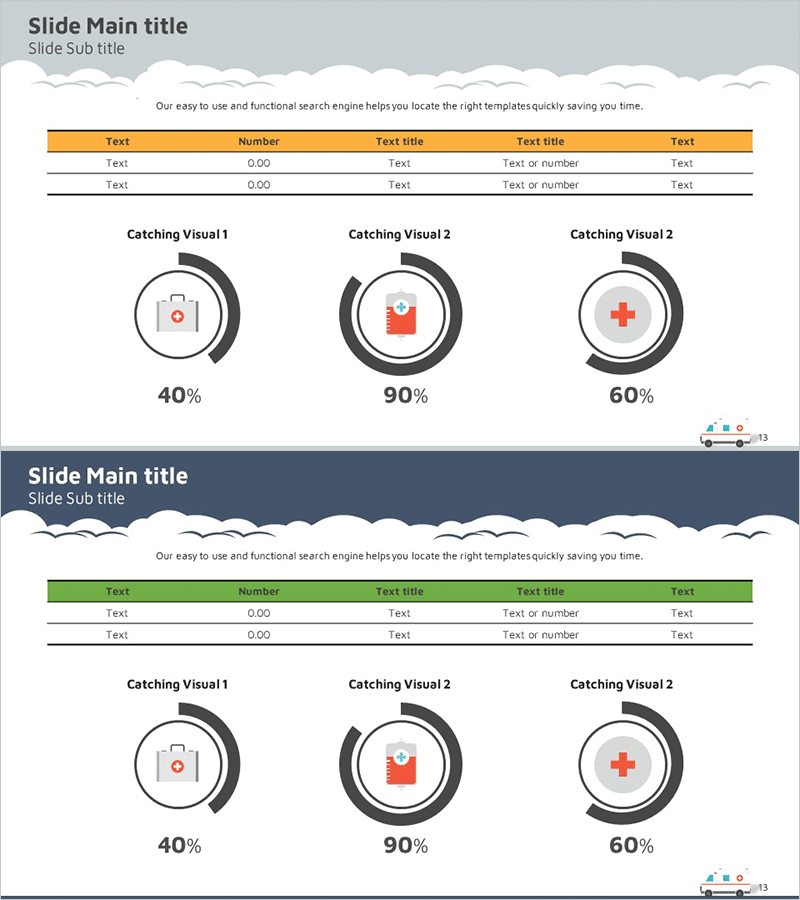
A PowerPoint slide combining a data table with donut-shaped pie charts for market analysis and performance reporting. This 2-slide set features a light gray background with an orange header table and three donut charts displaying 40%, 90%, and 60% metrics on the first slide. The second slide applies the same layout with a navy background and green header, allowing you to adjust presentation tone. Each donut chart includes circular arrow icons and precise percentage labels, making it ideal for market analysis sections in business plans, quarterly reports, and investor pitches across healthcare, technology, and marketing industries. Provided in 16:9 widescreen PPTX format for seamless editing.
Usage Points
-
Main Usage
Visualize three-item ratio data such as market share, product penetration rates, or customer satisfaction scores using donut-shaped pie charts, while simultaneously presenting exact figures in a structured data table to enhance presentation credibility.
-
How to Use
Use the first slide with light background for team meetings and seminars; switch to the second slide with dark background for executive briefings and online presentations. Simply replace the table figures and chart percentages with your own data for immediate deployment.
-
Recommended For
Ideal for market analysis sections in marketing plans, performance analysis in quarterly business reports, market overview explanations in investor pitch decks, and data comparison presentations in healthcare, technology, and financial services. Suitable for all organizational levels with minimal editing skills required.
-
Slide Structure
Slide 1: Light gray background + orange header table (5 columns × 2 rows) + 3 donut charts (40%, 90%, 60% labels) + circular arrow icons. Slide 2: Navy background + green header table + identical donut chart layout. 16:9 widescreen format.
Related Products
-

Business Status Chart – Presentation Template for Market Analysis
#Market and Competitor Analysis #Diagram #Graph
-

Investor Ratio Comparison Analysis Chart – Market Status and Competitive Analysis
#Company Introduction #Market and Competitor Analysis #Diagram
-

Donut Chart: Feature Usage Ratio in Mobile Banking
#Market and Competitor Analysis #Diagram #Graph
-

Orange Yellow Chart Analysis – Utilizing Diagrams and Graphs
#Market and Competitor Analysis #Financial Plans and Performance #Diagram
