Analysis of Customer Preference for Eco-Friendly Business Donut Chart
RJ0600070_15
- Last Update 07/08/2025
- File Size 5MB
- # of Slides 2
- File Format PPTX
- Slide Ratio 16:9
- Color
Keywords
- #Content-Based Slides
- #Design-Based Slides
- #Market and Competitor Analysis
- #Diagram
- #Graph
- #Market Share
- #Cluster
- #Circles
- #Chain Diagram
- #Doughnut Chart
- #16:9
- #donut chart PowerPoint
- #pie chart slide template
- #ratio analysis presentation
- #customer preference chart
- #donut graph template
- #market share diagram PowerPoint
About the Product
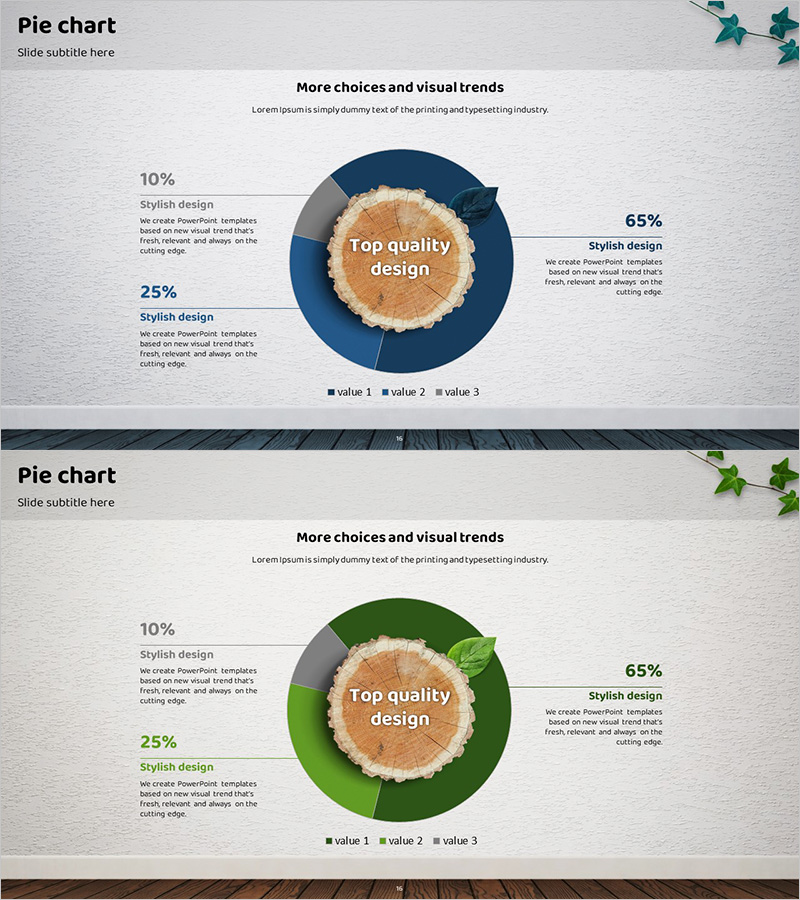
A 2-slide donut chart PowerPoint template visualizing customer preference for eco-friendly business across three data segments. The design places a central message area surrounded by percentage values, making it ideal for market share analysis, customer satisfaction metrics, and preference distribution. The navy blue and green color palette reinforces trust and environmental sustainability messaging. Formatted in 16:9 widescreen for modern presentation environments. Fully editable PPTX format allows quick data updates and color customization without design tools.
Usage Points
-
Main Usage
Display three or more data segments as proportional ratios using a donut chart format. The central message area combined with surrounding percentage labels creates clear information hierarchy, naturally guiding audience attention and improving numerical comprehension during presentations.
-
How to Use
Integrate into business plans, marketing proposals, and market analysis reports. Effective for customer satisfaction surveys, product preference studies, market segmentation, budget allocation breakdowns, and competitive positioning. Edit data values and labels directly in PowerPoint to match your specific presentation content.
-
Recommended For
Marketing professionals, sales teams, executives, consultants, and research analysts presenting customer insights and strategic recommendations. Ideal for eco-friendly business pitches, product launch presentations, quarterly performance reviews, and sustainability-focused investor meetings.
-
Slide Structure
2-slide set. Each slide features a central donut chart with 3 color-coded segments (navy, green, gray) and adjacent percentage text fields. The center ring provides space for key messaging such as 'Top quality design.' Layout supports both horizontal and vertical text placement for flexible content adaptation.
Related Products
-

Magic Donut Chart for Market Share Visualization – Key Information Delivery
#Product/Service Introduction #Market and Competitor Analysis #Diagram
-

Logistics Donut Chart – Performance and Market Shares
#Business Strategy #Market and Competitor Analysis #Diagram
-

Visualizing Educational Insights from Surveys with Doughnut Chart
#Market and Competitor Analysis #Diagram #Graph
-

Status of Research and Development by Topic – Innovation and Trust
#Product/Service Introduction #Market and Competitor Analysis #Diagram
