Performance Analysis with Donut Chart and Table
RB0800046_6
- Last Update 03/26/2025
- File Size 0.2MB
- # of Slides 2
- File Format PPTX
- Slide Ratio 4:3
- Color
Keywords
- #Content-Based Slides
- #Design-Based Slides
- #Market and Competitor Analysis
- #Diagram
- #Graph
- #Market Analysis
- #Market Overview
- #Table
- #Circles
- #Standard Table
- #Doughnut Chart
- #4:3
- #donut chart PowerPoint slide
- #pie chart presentation template
- #performance analysis slides
- #market overview chart
- #ratio visualization
- #donut graph template download
About the Product
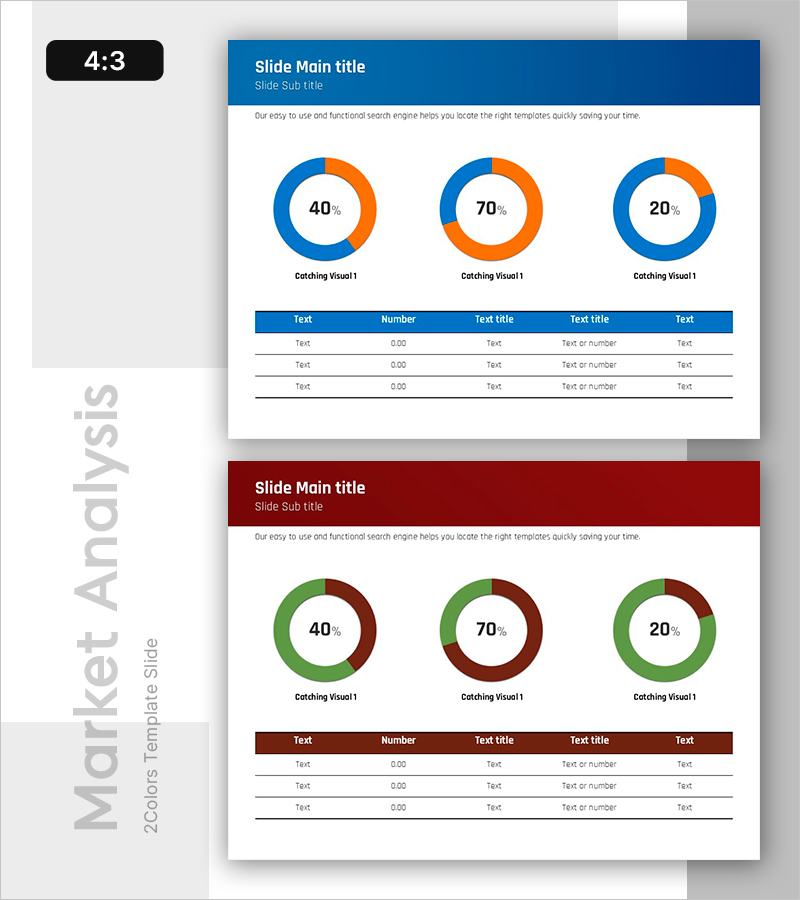
A PowerPoint slide deck for visualizing performance metrics and market overview using donut charts. This 2-slide presentation features three donut-shaped graphs displaying 40%, 70%, and 20% proportions, paired with a 5-column data table for detailed numerical breakdown. The blue and orange two-tone color scheme ensures clear visual hierarchy, while the structured table below each chart enables side-by-side comparison of key performance indicators. Ideal for business presentations, quarterly reports, and market analysis where ratio-based data visualization is essential.
Usage Points
-
Main Usage
Visualize performance metrics, market share, and goal achievement rates using three donut charts, with supporting numerical data organized in a structured table below. This layout enables quick comparison and helps audiences grasp key performance indicators at a glance.
-
How to Use
Customize each donut chart to represent different performance indicators or market segments by editing the labels and percentages. Update the data table with actual figures relevant to your analysis. Colors can remain as-is or be adjusted to match corporate branding. Duplicate the 2-slide set to add multiple analysis sections.
-
Recommended For
Marketing plans, business reports, market analysis presentations, quarterly performance reviews, investor pitch decks, and strategic planning sessions. Recommended for marketing professionals, sales teams, executives, and data analysts.
-
Slide Structure
Slide 1: Blue header + 3 donut charts (40%, 70%, 20% segments) + legend labels. Slide 2: Matching header + 5-column data table (Text, Number, Text title, Text title, Text) + 3 data entry rows. 4:3 aspect ratio, PPTX format.
Related Products
-

Detailed Analysis in Book Illustration PowerPoint Template
#Market and Competitor Analysis #Diagram #Graph
-

Market Analysis Donut Chart & Table Slide
#Market and Competitor Analysis #Diagram #Graph
-

Industry Trend Analysis Donut Chart – Visual Trends Presentation
#Market and Competitor Analysis #Diagram #Graph
-

Business Status and Market Analysis Doughnut Slide – Harmony of Blue and Orange
#Business Introduction #Market and Competitor Analysis #Diagram
