Business Status and Market Analysis Doughnut Slide – Harmony of Blue and Orange
RJ0400021_33
- Last Update 05/23/2025
- File Size 1.4MB
- # of Slides 2
- File Format PPTX
- Slide Ratio 16:9
- Color
Keywords
- #Content-Based Slides
- #Design-Based Slides
- #Business Introduction
- #Market and Competitor Analysis
- #Diagram
- #Graph
- #Market Analysis
- #Table
- #Circles
- #Standard Table
- #Doughnut Chart
- #16:9
- #doughnut chart PowerPoint
- #pie chart slide template
- #ratio visualization presentation
- #donut graph slide design
- #business analysis PowerPoint template
About the Product
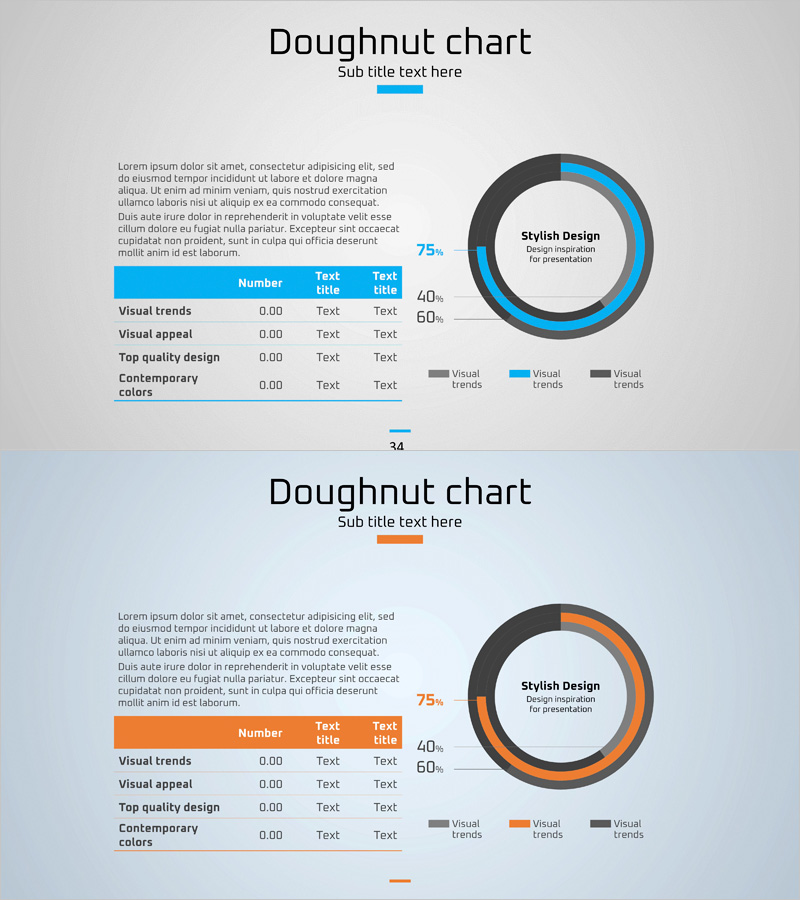
A doughnut chart PowerPoint slide that visualizes business status and market analysis across three segments using a two-tone blue and orange color scheme. The central circular area prominently displays a key metric (75%), creating strong visual emphasis. The layout combines a data table on the left with the doughnut chart on the right, enabling simultaneous presentation of quantitative data and visualization. Optimized for 16:9 widescreen format with 2 slides included, this template is ready for immediate use in presentations on business performance, market share, customer satisfaction, and other ratio-based metrics.
Usage Points
-
Main Usage
Effectively compares and highlights 3–4 ratio-based metrics such as business performance, market share, customer satisfaction, or revenue composition. The central metric (e.g., 75%) draws attention to the primary indicator, while the left-side table provides detailed numerical support.
-
How to Use
Edit the table on the left to input your actual data labels and values, then adjust the doughnut chart segments' colors and proportions to match your metrics. Customize the central figure and title to fit your presentation context, then insert into business reports, investor presentations, or marketing strategy decks.
-
Recommended For
Ideal for executives, business managers, marketing teams, financial analysts, and consultants presenting quarterly business reviews, market analysis, customer segmentation, or channel-based revenue breakdowns. Particularly effective in data-driven reports and investor pitch decks to enhance credibility.
-
Slide Structure
2-slide set. Each slide features a 4-row data table (3 columns: item, value, text) on the left and a 3-segment doughnut chart with central metric display on the right. Includes both blue and orange color variants for flexibility, optimized for 16:9 widescreen format.
Related Products
-

Development Status Analysis Chart - Visualization for Effective Market Analysis
#Product/Service Introduction #Market and Competitor Analysis #Diagram
-

Analysis Graph by Car Type – Insights with Doughnut Chart
#Business Introduction #Market and Competitor Analysis #Graph
-

Shareholder Status Survey Donut Graph – Optimized for Market Analysis
#Company Introduction #Market and Competitor Analysis #Diagram
-

Paint Splash Doughnut Chart – Sensuous Visuals
#Business Introduction #Financial Plans and Performance #Diagram
