Visualizing Seminar Insights – Business Strategy and Market Analysis
RM0900008_7
- Last Update 03/03/2025
- File Size 13.3MB
- # of Slides 2
- File Format PPTX
- Slide Ratio 16:9
- Color
Keywords
- #Content-Based Slides
- #Design-Based Slides
- #Business Strategy
- #Market and Competitor Analysis
- #Text Box
- #Achievements
- #Market Analysis
- #Rounded Rectangle Text Box
- #16:9
- #key takeaways PowerPoint slide
- #summary slide template
- #three-point ribbon layout
- #data visualization slide
- #business strategy presentation template
About the Product
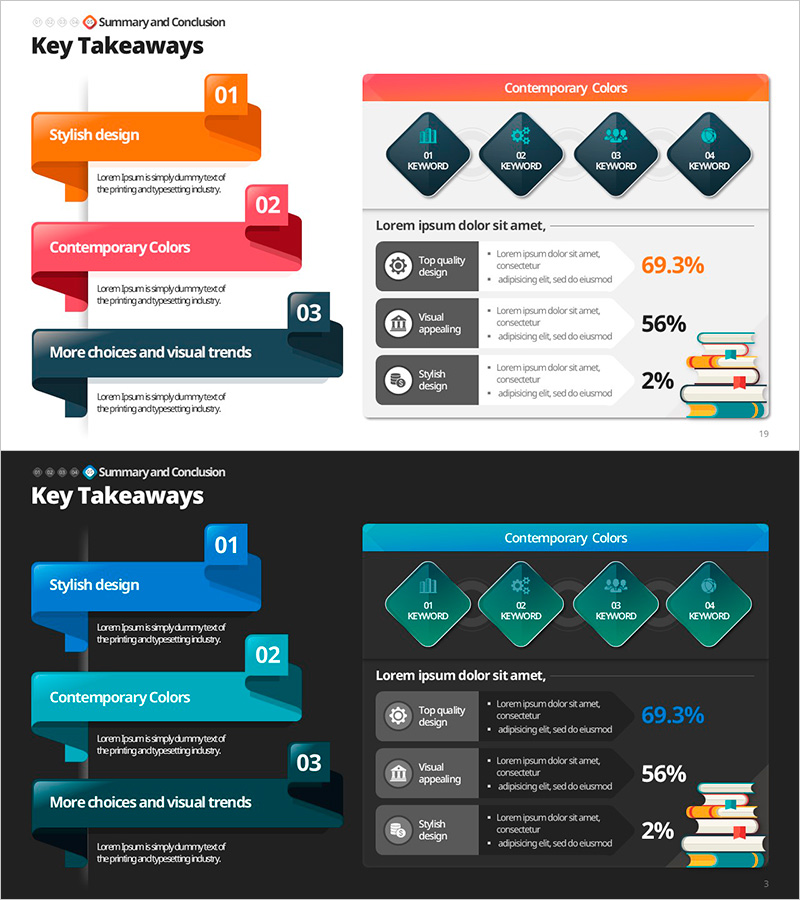
A 2-slide PowerPoint presentation template designed to highlight core insights and key takeaways in seminars, reports, and strategy presentations. The slide features three ribbon banners in orange, pink, and dark gray tones, each representing a major point with dedicated icon and text input areas. The right section provides space for detailed descriptions and numerical data visualization, making it ideal for presenting business strategies, market analysis, and management insights. The 16:9 widescreen format allows full customization of colors, text, and data elements for seamless integration into any corporate presentation.
Usage Points
-
Main Usage
Designed to emphasize core insights and capture audience attention during seminars, reports, and strategic presentations. The three ribbon banners create a clear information hierarchy, with the right section providing detailed explanations and supporting data to reinforce each key point.
-
How to Use
Enter main point titles in each ribbon banner and insert relevant icons or symbols in the designated areas. Add detailed descriptions and statistical data in the right section text boxes to strengthen your presentation narrative. Colors can be customized to match your corporate brand or presentation theme.
-
Recommended For
Executive briefings, business strategy presentations, market analysis seminars, quarterly performance summaries, investor relations meetings, and consulting proposals where emphasizing core messages is essential. Particularly effective for comparing or prioritizing three to five major items.
-
Slide Structure
Left side features three ribbon banners (orange, pink, dark gray) with numbered badges, icon spaces, and title text areas. Right side includes a detailed explanation section with three corresponding text boxes and a data visualization area for percentages, charts, and graphs.
Related Products
-

Selected Area Graphs – Market and Performance Analysis
#Business Strategy #Market and Competitor Analysis #Graph
-

Orange and Grapefruit Consumption Ratio – Visualized Performance Analysis
#Business Strategy #Market and Competitor Analysis #Graph
-

Business Promotion Strategy Slide Template – Effective Market and Competitor Analysis
#Business Strategy #Market and Competitor Analysis #Graph
-

Analysis by Figures with Horizontal Bar Chart – Data-Driven Market Strategy
#Business Strategy #Market and Competitor Analysis #Graph
