Graphic Survey & Feedback Analysis – Visualizing Customer Insights
RM0900007_7
- Last Update 03/03/2025
- File Size 0.4MB
- # of Slides 2
- File Format PPTX
- Slide Ratio 16:9
- Color
Keywords
- #Content-Based Slides
- #Design-Based Slides
- #Market and Competitor Analysis
- #Customer Success Stories
- #Graph
- #Customer Analysis
- #Customer Testimonials and Feedback
- #Horizontal Bar
- #Circles
- #Horizontal Bar Chart
- #Pie Chart
- #16:9
- #pie chart PowerPoint slide
- #survey analysis presentation
- #customer feedback visualization
- #data visualization slides
- #bar graph PPT template
About the Product
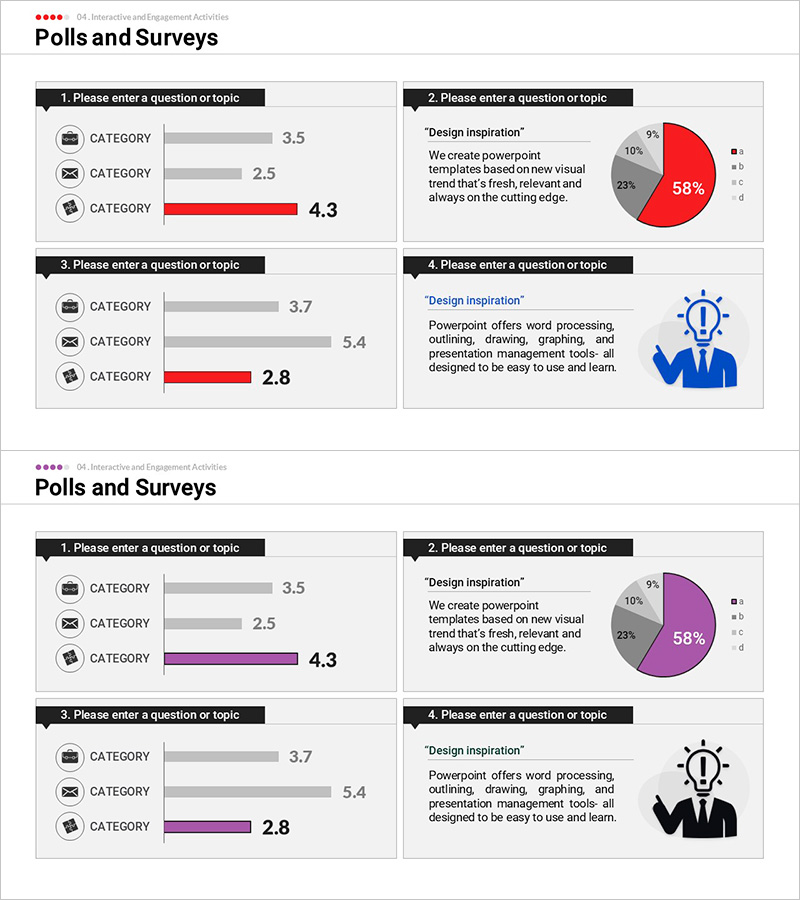
A 2-slide PowerPoint presentation that visualizes customer survey and feedback data using pie charts and bar graphs. The design employs a clear color scheme of red, gray, and black to distinguish each segment and score at a glance. Icons and descriptive text are strategically placed for immediate presentation use. This slide template is optimized for business presentations requiring data-driven decision-making, such as customer satisfaction surveys, product feedback analysis, and market research reporting.
Usage Points
-
Main Usage
Visualize customer satisfaction surveys, product feedback analysis, and market research results using pie charts and bar graphs to support data-driven decision-making. The 4-segment pie chart clearly expresses composition ratios, while horizontal bar graphs enable comparative analysis of item-by-item scores.
-
How to Use
Place the pie chart and explanatory text on the first slide to emphasize key feedback results. Use the second slide to display multiple item scores in horizontal bar graph format. Add icons and interpretation text beside each chart to enhance audience comprehension and engagement.
-
Recommended For
Marketing teams presenting customer analysis reports, product development teams sharing user feedback, executive-level quarterly performance reviews, consulting firms presenting market research findings, and educational institutions sharing satisfaction survey results.
-
Slide Structure
Slide 1: Title area + 4-segment pie chart (red 58%, gray 23%, black 10%, gray 9%) + right-aligned descriptive text box. Slide 2: Title area + 3-item horizontal bar graph (scores 3.5, 2.5, 4.3) + icons + interpretation text. 16:9 aspect ratio, PPTX format.
Related Products
-

Space Industry Analysis Graph Chart – Market and Competitive Analysis
#Market and Competitor Analysis #Graph #Customer Analysis
-

Real User Feedback & Reactions – Insights from Real Testimonials
#Market and Competitor Analysis #Customer Success Stories #Text Box
-

Patient Satisfaction Survey Results Pie Chart Slide – Market Status Analysis
#Market and Competitor Analysis #Graph #Market Status
-

Gender Comparison Analysis Pairwise Bar Graph – Understanding Customers' First Step
#Market and Competitor Analysis #Customer Success Stories #Graph
