Visual Insights on Education Analysis PowerPoint
RM0900005_8
- Last Update 03/03/2025
- File Size 1.3MB
- # of Slides 2
- File Format PPTX
- Slide Ratio 16:9
- Color
Keywords
- #Content-Based Slides
- #Design-Based Slides
- #Market and Competitor Analysis
- #Diagram
- #Graph
- #Market Status
- #Market Analysis
- #Cluster
- #Circles
- #Chain Diagram
- #Doughnut Chart
- #16:9
- #donut chart PowerPoint
- #4-section pie chart slide
- #education analysis presentation
- #data visualization diagram
- #ratio chart template download
About the Product
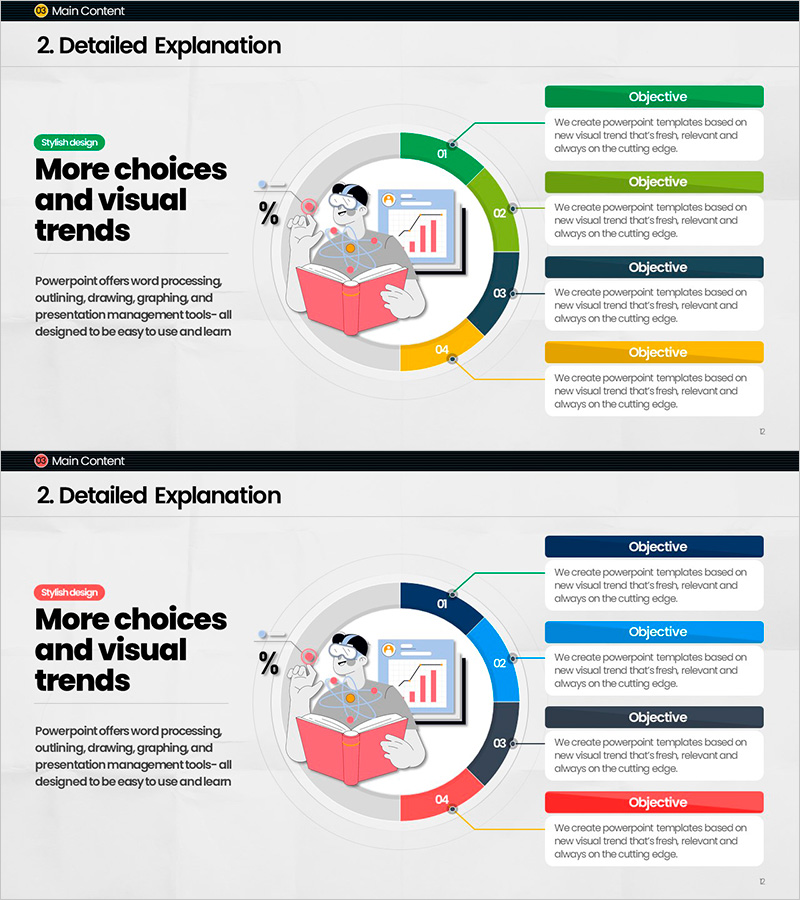
A donut chart PowerPoint slide that visualizes education analysis data across four distinct sections with clear color differentiation: green, blue, navy, and yellow. The left side features an illustration paired with key messaging, while the right side displays four objective items connected by linking lines. This slide design effectively communicates data-driven insights for educational market analysis, student performance evaluation, program assessment, and institutional reporting. The donut format allows viewers to instantly grasp proportions and composition while maintaining visual clarity and professional presentation standards.
Usage Points
-
Main Usage
Designed to break down education analysis, market research, and performance evaluation data into four comparable segments. The donut chart's center space accommodates key metrics or messages, while the right-side objective boxes provide detailed explanations for each data segment, supporting data-driven decision-making and stakeholder communication.
-
How to Use
Enter your presentation topic or core message in the left illustration area. Input corresponding data values into the four donut chart sections. Complete the four objective boxes on the right with segment-specific insights or explanations. Audiences will quickly understand data relationships and implications. Colors are fully editable to match organizational branding and presentation themes.
-
Recommended For
Ideal for educational institutions presenting student performance metrics, program evaluations, and institutional reports. Suitable for market research presentations, business analysis briefings, academic seminars, and policy explanation sessions. Effective for educators, researchers, marketing professionals, consultants, and analysts communicating quantitative findings to diverse audiences.
-
Slide Structure
Two-slide set with 16:9 widescreen format optimized for modern projectors and digital displays. Each slide divides into left section (40%) containing illustration and text area, and right section (60%) featuring the donut chart and four objective boxes. The donut chart contains four color-coded segments with connecting lines linking to corresponding objective boxes, creating visual flow and data hierarchy.
Related Products
-

Stylish Design Business Presentation Template
#Market and Competitor Analysis #Graph #Market Status
-

Real Estate Performance Status Donut Graph – Essential for Market Analysis
#Market and Competitor Analysis #Graph #Market Status
-

Residential Lighting Graph – Market Analysis
#Market and Competitor Analysis #Graph #Other
-

Idea Presentation Template Wide – Market Analysis and Visualization
#Market and Competitor Analysis #Graph #Other
