In-depth Analysis STEP4 Diagram – Visualizing Project Strategy Schedule
RM0900002_12
- Last Update 10/05/2025
- File Size 0.6MB
- # of Slides 2
- File Format PPTX
- Slide Ratio 16:9
- Color
Keywords
- #Content-Based Slides
- #Design-Based Slides
- #Business Strategy
- #Business Management
- #Diagram
- #Step-by-Step Schedule Plan
- #Execution Plan
- #Flow
- #Linear Flow
- #16:9
- #4-step diagram PowerPoint
- #linear flowchart slide
- #business strategy timeline
- #phased implementation schedule
- #process diagram PowerPoint template
About the Product
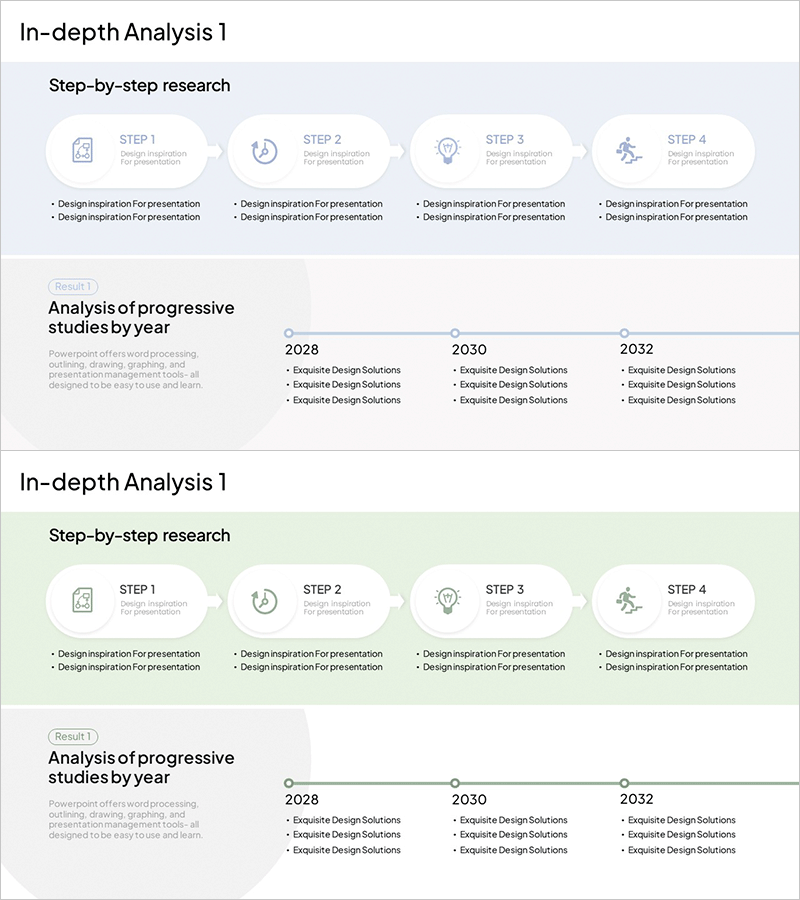
A 4-step linear diagram PowerPoint slide designed to clearly present business strategy and phased implementation schedules. Each step features an icon and text area to convey process flow intuitively. Connection lines show relationships between stages, while the year-based timeline below (2028·2030·2032) allows you to add temporal information. Easily editable to match your company brand colors, this presentation template is ready for immediate use in business plans, strategy reports, and investor pitches.
Usage Points
-
Main Usage
Designed to present phased business strategy execution and year-by-year schedules at a glance. Each step clearly expresses key activities and objectives through icons and text, while the timeline adds temporal context to make the strategic plan concrete and actionable.
-
How to Use
Enter phase names and descriptions in each STEP box, then add detailed implementation content in the year-based sections below. Icons can be customized to match each phase's characteristics, and background and text colors can be adjusted to your company brand. Insert into business plan strategy sections or executive reports for maximum impact.
-
Recommended For
Ideal for executives, strategy teams, and project managers developing and executing business strategies. Highly effective for presenting new business initiatives, organizational restructuring, digital transformation, and other long-term strategies. Strengthens investor persuasion materials and internal team alignment meetings.
-
Slide Structure
Four connected step boxes (STEP 1–4) arranged linearly at the top, each with an icon and text input area. Below is a timeline showing three year intervals (2028·2030·2032), with bullet-point sections under each year for detailed content entry.
Related Products
-

Basic Physical Exercise Sequence – Simple Step-by-Step Activities
#Business Strategy #Business Management #Diagram
-

Step by Step Plan Linear Diagram – Effective Business Strategy
#Business Strategy #Business Management #Diagram
-

Aging Process Diagram – Visualizing Stages of Change
#Business Strategy #Business Management #Diagram
-

Interior Template Propulsion Direction – Step-by-Step Schedule
#Business Strategy #Business Management #Diagram
