Current Trends and Issues Chart – Simplifying Market Analysis
RM0900001_8
- Last Update 03/02/2025
- File Size 0.7MB
- # of Slides 2
- File Format PPTX
- Slide Ratio 16:9
- Color
Keywords
- #Content-Based Slides
- #Design-Based Slides
- #Market and Competitor Analysis
- #Graph
- #Market Analysis
- #Column
- #Grouped Column
- #16:9
- #grouped bar chart PowerPoint
- #trend analysis slide template
- #market analysis presentation
- #4-item comparison chart
- #data visualization PowerPoint
- #how to create bar chart in PowerPoint
About the Product
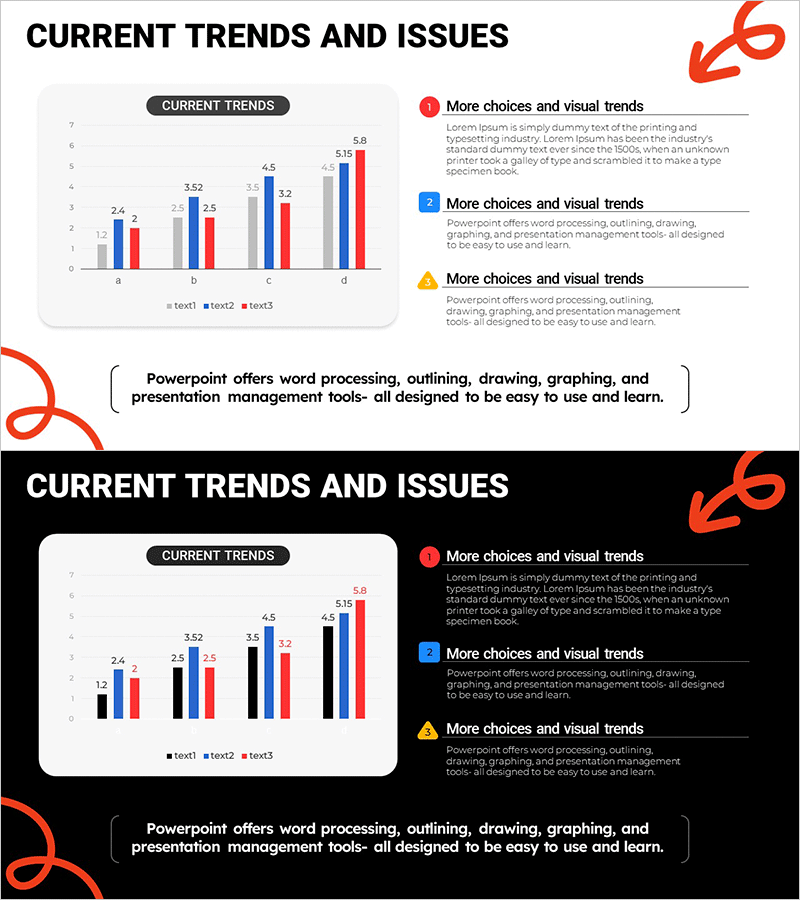
A grouped bar chart PowerPoint slide designed to visualize current trends and issues through comparative analysis. This slide template displays four items (a, b, c, d) with three data series (text1, text2, text3) simultaneously, making it ideal for market analysis, competitive benchmarking, and performance metrics presentations. The blue and red color contrast ensures clear data differentiation, while the balanced layout of the left chart area and right text section allows for both visual data representation and insight explanation. The 2-slide set includes both light and dark background versions, enabling flexible adaptation to different presentation environments and lighting conditions.
Usage Points
-
Main Usage
This slide enables side-by-side comparison of multiple data series across several items, such as market trends, competitive positioning, or quarterly performance metrics. The grouped bar structure clearly highlights differences between data series for each item, while the dual-panel layout (chart + text) allows simultaneous presentation of visual data and analytical insights.
-
How to Use
Replace the bar heights and colors with your actual data values, then populate the right-side text boxes with key findings, analysis conclusions, or action items. Use the light background version for standard conference rooms and online presentations, and the dark background version for large auditoriums or video recording sessions.
-
Recommended For
Recommended for marketing professionals, strategy planners, sales leaders, and executive presentations. Ideal for quarterly performance reviews, market research findings, competitive analysis, product launch strategy sessions, and any business presentation requiring quantitative comparative analysis.
-
Slide Structure
2-slide set with identical layouts. Each slide features a grouped bar chart on the left displaying 4 items (a, b, c, d) with 3 data series, and a right panel with a circular arrow icon and 3 numbered text boxes (red, blue, yellow markers) highlighting key points. Formatted in 16:9 widescreen ratio for modern presentation environments.
Related Products
-

Regional Competitive Advantage Chart – Essential Tool for Market and Competitor Analysis
#Company Introduction #Market and Competitor Analysis #Graph
-

Comparative Mixed Graph – Market and Competitor Analysis
#Market and Competitor Analysis #Graph #Market Status
-

Infographic Slide Highlighting Visualized Data – Modern Design
#Market and Competitor Analysis #Graph #Competitor Analysis
-

Visual Data Overview of Research Findings – Beginning of Innovation
#Market and Competitor Analysis #Graph #Market Analysis
