Horizontal Bar Chart for Recent Case Receipt Trends – Market Status
RJ0800010_19
- Last Update 08/02/2025
- File Size 0.8MB
- # of Slides 2
- File Format PPTX
- Slide Ratio 16:9
- Color
Keywords
About the Product
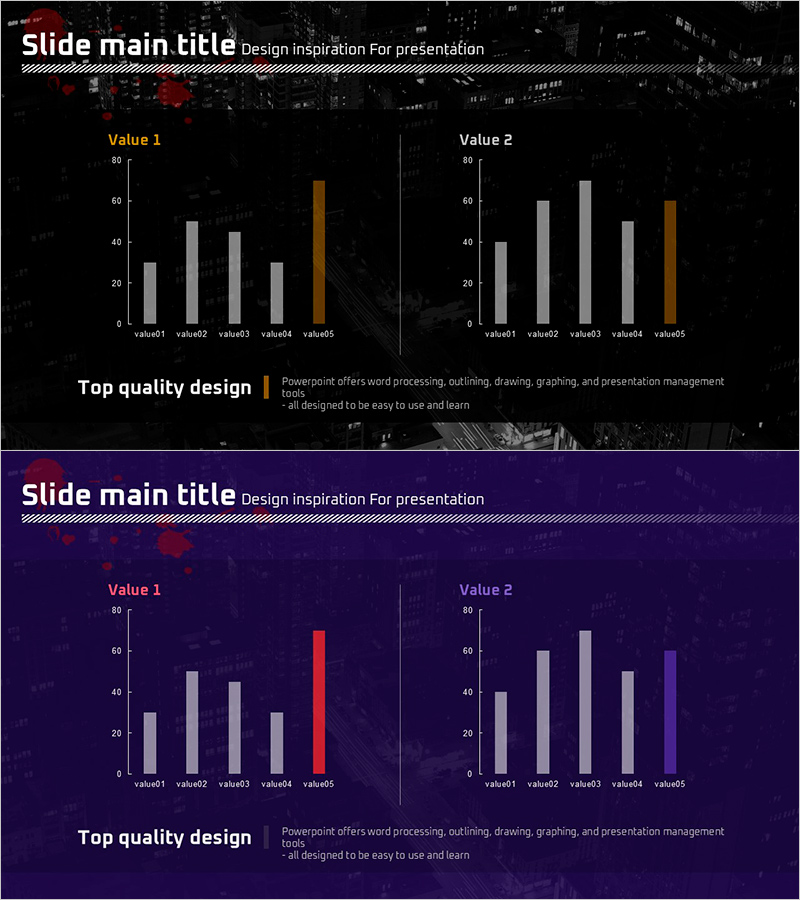
A horizontal bar chart PowerPoint slide set designed for market status analysis and recent case receipt trend visualization. This 2-slide template features a dark background with gray and orange accent colors, comparing two data series (Value 1 and Value 2) across five items (value01 through value05). Provided in 16:9 widescreen PPTX format, each slide includes a title section and descriptive text box for immediate presentation use. Data values are fully editable, making it ideal for marketing reports, market analysis documents, business performance presentations, and comparative data visualization.
Usage Points
-
Main Usage
Optimized for comparing two data series simultaneously, such as market trends, case receipt patterns, sales volumes, or performance metrics. The horizontal bar layout enables clear visual comparison of values across categories, enhancing audience comprehension of data differences.
-
How to Use
Replace the item labels (value01–value05) and numerical values with your own data. The gray and orange accent colors can be customized to reflect importance levels or category distinctions. The dark background ensures excellent visibility in projector environments and professional presentation settings.
-
Recommended For
Marketing team market analysis reports, sales team performance comparison presentations, executive business status briefings, consulting firm client analysis materials, and academic presentations requiring data visualization components.
-
Slide Structure
2-slide set. Each slide contains a title area (main title + subtitle), two horizontal bar chart sections (Value 1 and Value 2), and a descriptive text box at the bottom. Charts display five data items using gray bars with orange accent highlights, including Y-axis labels and numerical values.
Related Products
-

Horizontal Bar Chart Slide for USA Market Analysis
#Market and Competitor Analysis #Graph #Other
-

Market Overview PowerPoint Slide – Two Panel Market Analysis
#Market and Competitor Analysis #Graph #Market Status
-

Data Visualization with Market Analysis Vertical Bar Graph
#Market and Competitor Analysis #Graph #Market Status
-

Strategic Market Analysis Bar Chart
#Market and Competitor Analysis #Graph #Market Status
