Data Visualization with Market Analysis Vertical Bar Graph
RJ0600004_4
- Last Update 06/22/2025
- File Size 2.6MB
- # of Slides 2
- File Format PPTX
- Slide Ratio 16:9
- Color
Keywords
About the Product
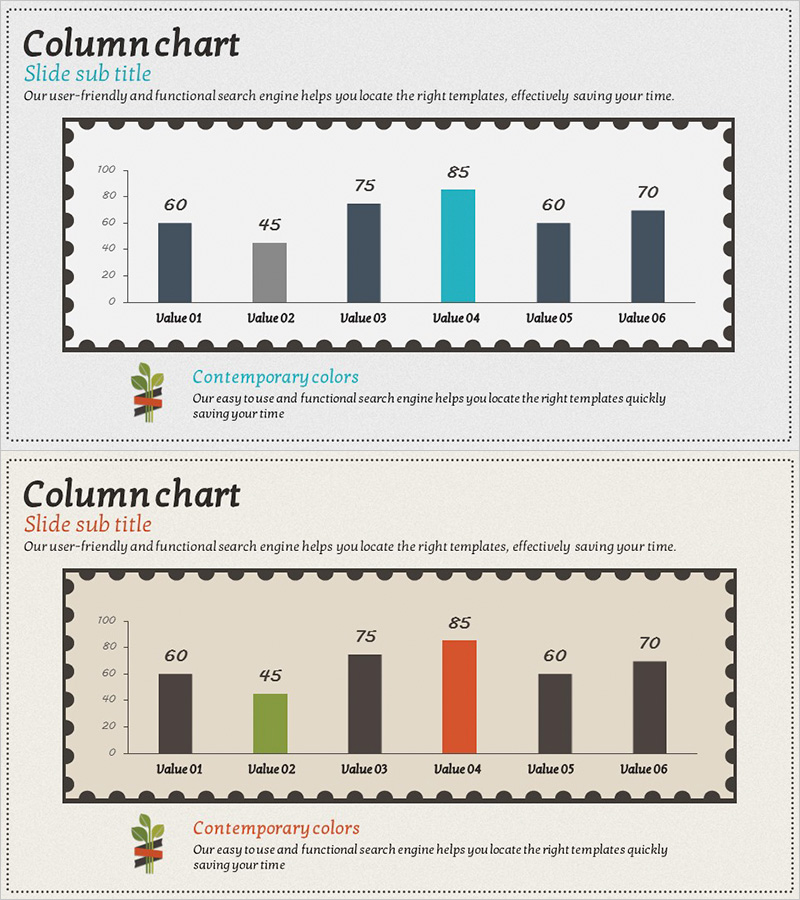
A vertical bar chart PowerPoint slide optimized for market analysis and business presentations. This 2-slide set compares six data points with clear visual hierarchy. The first slide uses a multi-color palette of charcoal, gray, and teal tones; the second emphasizes a key metric with charcoal, olive, and orange accents. Both slides feature Y-axis gridlines (0–100) and data labels for precise numerical communication. Ideal for quarterly reports, sales performance analysis, competitive benchmarking, and market overview presentations that require straightforward data comparison.
Usage Points
-
Main Usage
Visualizes six quantitative data points through bar height comparison, making numerical relationships immediately apparent. Y-axis gridlines and value labels ensure accurate data interpretation for market analysis, sales metrics, and competitive positioning.
-
How to Use
Slide 1 presents all items with balanced multi-color treatment; Slide 2 highlights a key metric (Value 04) with accent color emphasis. Select the layout matching your narrative focus, or customize colors to align with corporate branding guidelines.
-
Recommended For
Marketing managers, sales directors, business analysts, financial officers, and executives presenting quarterly results, market trends, competitive analysis, or performance benchmarks to stakeholders.
-
Slide Structure
Two-slide layout. Each slide displays six vertical bars (Value 01–06) aligned with Y-axis scale (0–100) and topped with numerical labels. Slide 1 uses balanced multi-color scheme (charcoal, gray, teal); Slide 2 applies accent coloring (charcoal, olive, orange) to highlight comparative emphasis.
Related Products
-

Strategic Market Analysis Bar Chart
#Market and Competitor Analysis #Graph #Market Status
-

Weather Change Vertical Bar Graph Analysis - Understanding Market Status
#Market and Competitor Analysis #Graph #Market Status
-

Bar Chart for Portion of Meals – Visualizing Market Status
#Market and Competitor Analysis #Graph #Market Status
-

Horizontal Bar Chart Slide for USA Market Analysis
#Market and Competitor Analysis #Graph #Other
