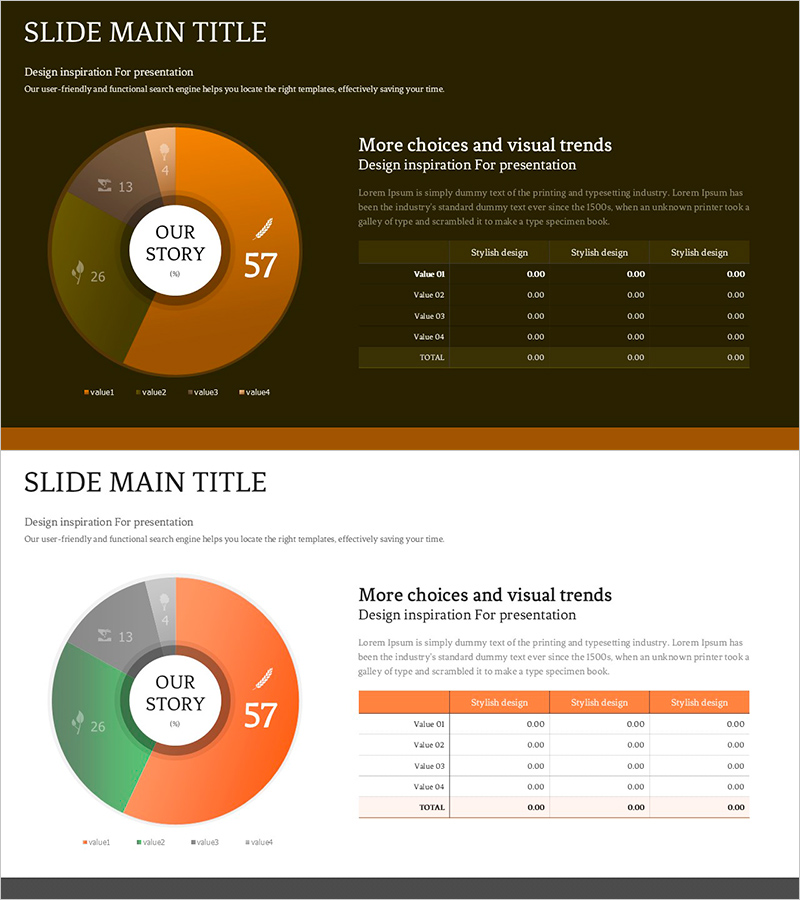
Doughnut Chart Visualizing Proportion of Grain Yields
RJ0600096_11
- Last Update 07/16/2025
- File Size 0.1MB
- # of Slides 2
- File Format PPTX
- Slide Ratio 16:9
- Color
Keywords
About the Product
A 4-segment doughnut chart PowerPoint slide that intuitively visualizes the proportion of grain yields across different categories. The circular chart is divided into four distinct segments using orange, olive, gray, and beige colors, clearly representing each item's percentage share. The center 'OUR STORY' text area accommodates key figures or titles, while the accompanying data table on the right provides detailed numerical context. Optimized for market analysis, proportion comparison, and composition ratio presentations. Ready-to-use in 16:9 widescreen format across 2 slides.
Usage Points
-
Main Usage
A data visualization slide designed to represent market share, proportions, and composition ratios using a circular chart format. Ideal for comparing grain and agricultural production volumes, sales composition, customer distribution, and other 4-item relative share analyses at a glance.
-
How to Use
Enter your key figures or title in the center circular area, then input each item name and percentage in the four segments. Complete the presentation by filling the data table on the right with detailed numerical values. Colors can remain as designed or be customized to match your corporate brand palette.
-
Recommended For
Recommended for agricultural and food industry reports, market analysis presentations, business performance reviews, product sales status analysis, and investor pitch decks. Ideal for executives, marketing teams, and sales departments using proportion-based decision-making materials.
-
Slide Structure
One doughnut-shaped pie chart (4-segment with center text area) plus a data table on the right (4 rows × 4 columns). Each segment is color-coded with legend and numerical labels included. The 2-slide set allows representation of multiple data scenarios.
Related Products
-

Guide to Admission Evaluation Criteria with Donut Chart
#Market and Competitor Analysis #Graph #Market Status
-

Visualizing Fish Market Share with Doughnut Chart – Vitality of the Ocean
#Market and Competitor Analysis #Graph #Market Status
-

Management System Donut Chart Slide – Market Share and Status
#Market and Competitor Analysis #Graph #Market Status
-

Visualizing Value Ratios with Pie Charts – Essential Presentation Template
#Market and Competitor Analysis #Diagram #Graph
