In-Depth Analysis Graph Chart – Optimized for Market and Competitor Analysis
RM0900001_12
- Last Update 03/02/2025
- File Size 1.2MB
- # of Slides 2
- File Format PPTX
- Slide Ratio 16:9
- Color
Keywords
About the Product
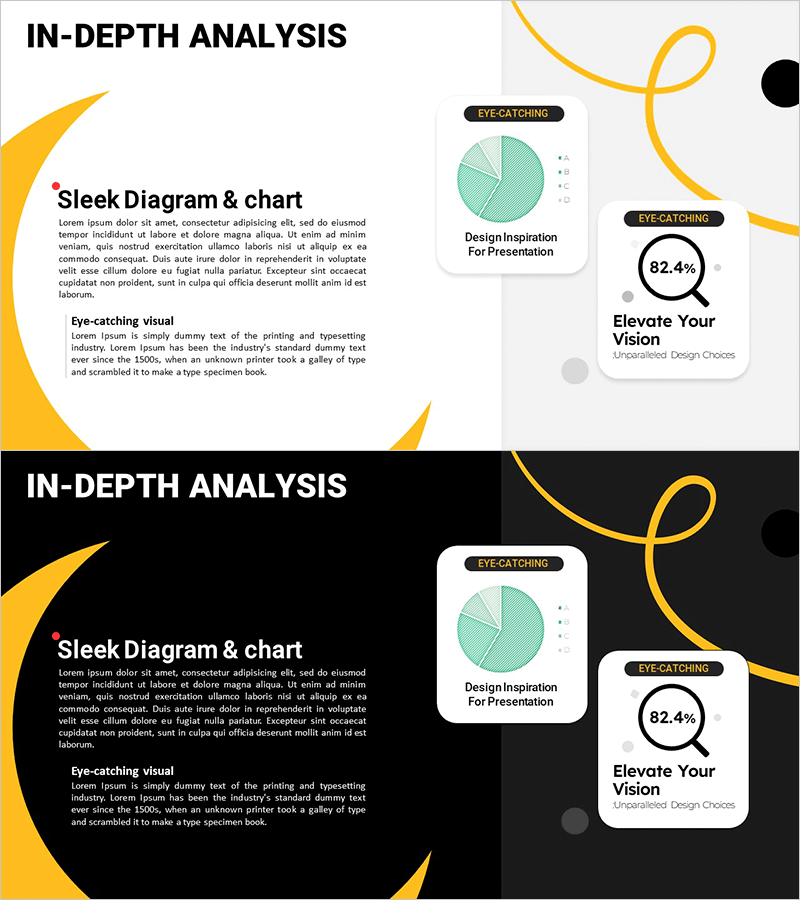
A PowerPoint presentation slide optimized for market analysis and competitor analysis. Features yellow curved design elements, mint-toned pie charts, and percentage value displays for intuitive data ratio communication. The 2-slide set includes both light and dark background versions, allowing you to choose based on your presentation environment and document style. Provided in fully editable PPTX format, enabling you to modify chart data and text freely. Perfect for business reports, strategic presentations, and data-driven decision-making materials.
Usage Points
-
Main Usage
Optimized for expressing proportional relationships such as market size, market share, customer composition, and revenue distribution through pie charts. Ideal for visualizing market share comparisons, product category sales ratios, and customer segment composition in competitor analysis sections.
-
How to Use
Use the light background slide for printed materials or online presentations, and the dark background slide for in-person presentations or video recordings. Double-click the chart to edit colors, legends, and percentage values directly. Modify titles and descriptions in text boxes to customize for your specific data.
-
Recommended For
Recommended for executive reports, business plans, investment pitch decks, marketing strategy documents, and quarterly performance reports. Particularly valuable for market analysis, competitor analysis, customer analysis, and financial overview sections. Ideal for executives, planners, analysts, and marketing professionals requiring data-driven presentations.
-
Slide Structure
2-slide composition. Each slide contains a title area, pie chart (4-5 segments), legend, and percentage value display section. Yellow curved decorative elements positioned at the top and right side provide visual consistency. Includes both light gray background and charcoal black background versions for flexible presentation needs.
Related Products
-

Comparative Analysis Vertical Bar Graph for Market Insights
#Market and Competitor Analysis #Graph #Other
-

Rocket Illustration Template Cover – Area Graph for Market Analysis
#Market and Competitor Analysis #Graph #Other
-

PC Mockup & Column Bundle Graph
#Market and Competitor Analysis #Graph #Other
-

Graph Slide for Market and Competitor Analysis – Online Market Overview
#Market and Competitor Analysis #Diagram #Graph
