Stacked Chart of Segmented Portfolio Contributions – A Powerful Tool for Business Strategy
RB0100008_5
- Last Update 03/01/2025
- File Size 3.2MB
- # of Slides 2
- File Format PPTX
- Slide Ratio 4:3
- Color
Keywords
- #Content-Based Slides
- #Design-Based Slides
- #Business Strategy
- #Market and Competitor Analysis
- #Graph
- #Market Share
- #Market Analysis
- #Column
- #Segmented Column
- #4:3
- #stacked bar chart PowerPoint
- #cumulative data slide
- #segmented portfolio visualization
- #business strategy chart
- #performance comparison template
About the Product
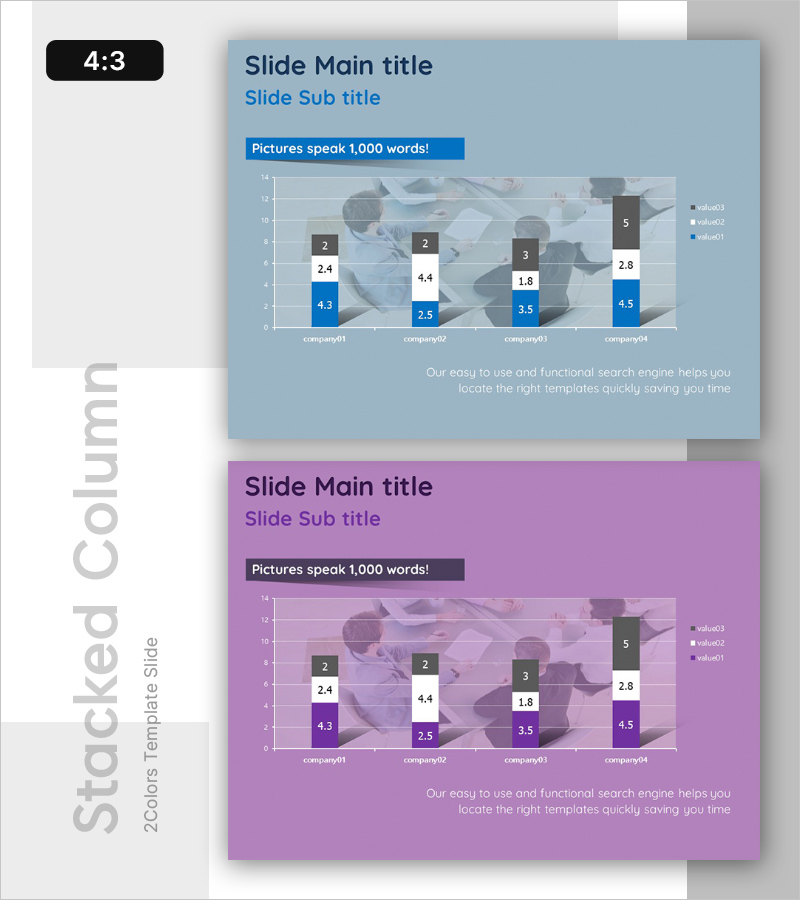
An essential stacked bar chart PowerPoint slide for business strategy presentations and market analysis. This template visualizes four data series in cumulative form, simultaneously displaying total volume and compositional proportions. Designed with a light blue background and white, dark gray, and blue bar segments, it integrates seamlessly into corporate presentations and reports. The 2-slide set accommodates various data scenarios, and the 4:3 aspect ratio ensures compatibility with existing presentations.
Usage Points
-
Main Usage
Compares multiple series of cumulative data—such as business performance, market share, or portfolio composition—at a glance while tracking overall magnitude changes. Simultaneously conveys absolute values and relative proportions of each series to strengthen decision-making rationale.
-
How to Use
Input quarterly revenue, customer counts, or market share data for four companies, departments, or product lines to perform cumulative comparative analysis. The light blue background and white text ensure excellent readability during projector presentations and print materials.
-
Recommended For
Ideal for executive reports, quarterly performance presentations, market analysis documents, portfolio reviews, and business planning phases. Particularly valuable for finance, marketing, and strategy departments delivering data-driven presentations.
-
Slide Structure
A 2-slide set providing identical stacked bar chart layouts. Each slide displays four data series (value01–value03 plus legend) and supports cumulative comparison across four categories (company01–company04). Delivered in 4:3 aspect ratio PPTX format, fully editable in all PowerPoint versions.
Related Products
-

Visualizing the Changing Trend of the Ageing Population with a 100% Stacked Bar Graph
#Business Strategy #Market and Competitor Analysis #Marketing Plan and Strategy
-

Market Share Analysis with Horizontal Bar Chart – Harmonizing Blue and Red
#Market and Competitor Analysis #Graph #Market Share
-

Vertical Bar Chart Slide | Data Comparison & Analysis PPT
#Business Strategy #Market and Competitor Analysis #Graph
-

Sales Profit Margin Change Factor Analysis via Vertical Bar Chart
#Business Strategy #Market and Competitor Analysis #Graph
