Market Share Analysis with Horizontal Bar Chart – Harmonizing Blue and Red
RJ0400020_12
- Last Update 05/22/2025
- File Size 0.2MB
- # of Slides 2
- File Format PPTX
- Slide Ratio 16:9
- Color
Keywords
About the Product
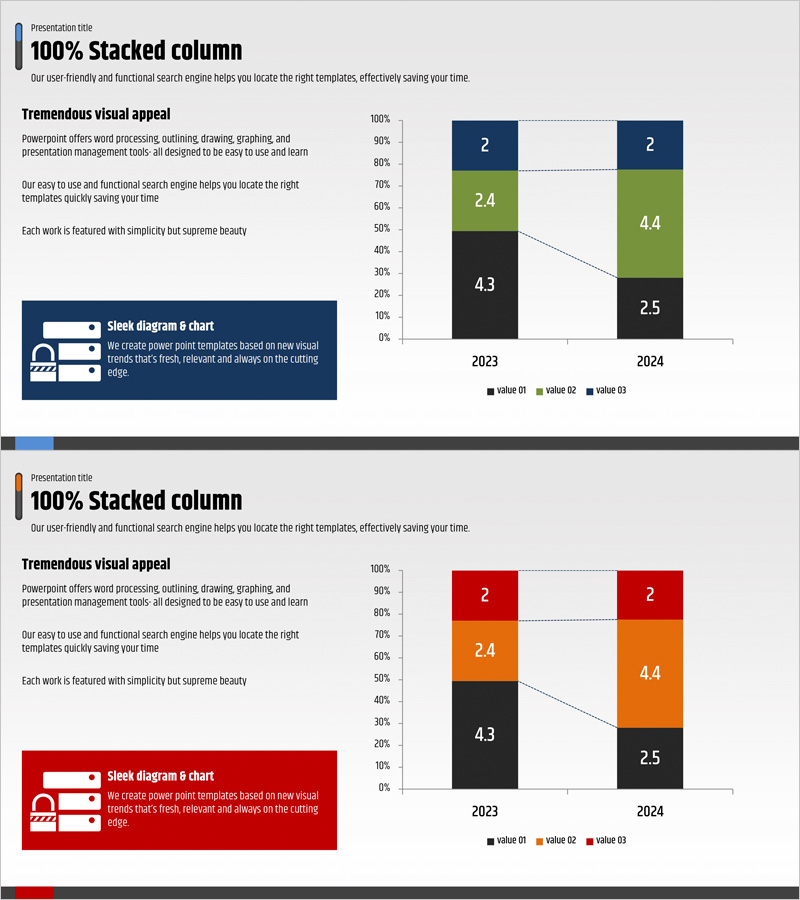
A PowerPoint slide comparing market share data for 2023 and 2024 using horizontal bar charts. The design features contrasting dark blue and orange color schemes to clearly distinguish data points across two time periods, with numerical labels displayed on each bar segment for precise value comparison. Formatted in 16:9 widescreen ratio with 2 slides, this presentation template is ready to use for competitive analysis, market trend reports, business performance reviews, and strategic planning presentations. The editable PPTX format allows you to customize colors, values, and labels to match your specific data and branding requirements.
Usage Points
-
Main Usage
Visualizes year-over-year and competitor market share data using horizontal bar charts to enable clear comparative analysis. The contrasting color scheme makes differences immediately apparent, while numerical labels on each bar segment support precise value comparison and data-driven decision making.
-
How to Use
Ideal for business reports, marketing strategy presentations, investor briefings, executive dashboards, and competitive positioning discussions. Simply update the numerical values, labels, and colors to match your data, then insert into your presentation deck for immediate use without additional design work.
-
Recommended For
Marketing professionals, business strategists, executives, investor relations specialists, management consultants, and analysts who need to communicate market positioning and competitive landscape effectively. Perfect for market analysis reports, quarterly business reviews, and strategic planning sessions.
-
Slide Structure
2-slide set featuring horizontal bar charts with 2 data series (dark blue and orange) displayed in 100% stacked format. Each slide represents a different time period (2023 and 2024), with numerical labels positioned on bar segments for easy value reading and comparison across categories.
Related Products
-

Stacked Chart of Segmented Portfolio Contributions – A Powerful Tool for Business Strategy
#Business Strategy #Market and Competitor Analysis #Graph
-

Company Service Analysis Graph – A Snapshot of Market Trends
#Market and Competitor Analysis #Financial Plans and Performance #Graph
-

Orange Purple Subdivided Graph Table – Visualizing Market Data
#Market and Competitor Analysis #Diagram #Graph
-

Business Goal Setting & Analysis Graph – For Competitive Analysis
#Market and Competitor Analysis #Marketing Plan and Strategy #Graph
