Final Security Strategy & Recommendations Slide – Operational Plan and Visual Design
RM0800011_6
- Last Update 03/01/2025
- File Size 2.1MB
- # of Slides 2
- File Format PPTX
- Slide Ratio 16:9
- Color
Keywords
- #Content-Based Slides
- #Design-Based Slides
- #Operational Plan
- #Diagram
- #Production and Technology Development Strategy
- #Capital Investment Plan
- #Table
- #Standard Table
- #16:9
- #table diagram PowerPoint
- #horizontal data chart slide
- #comparison table template
- #operational plan presentation
- #data visualization PPT slide
About the Product
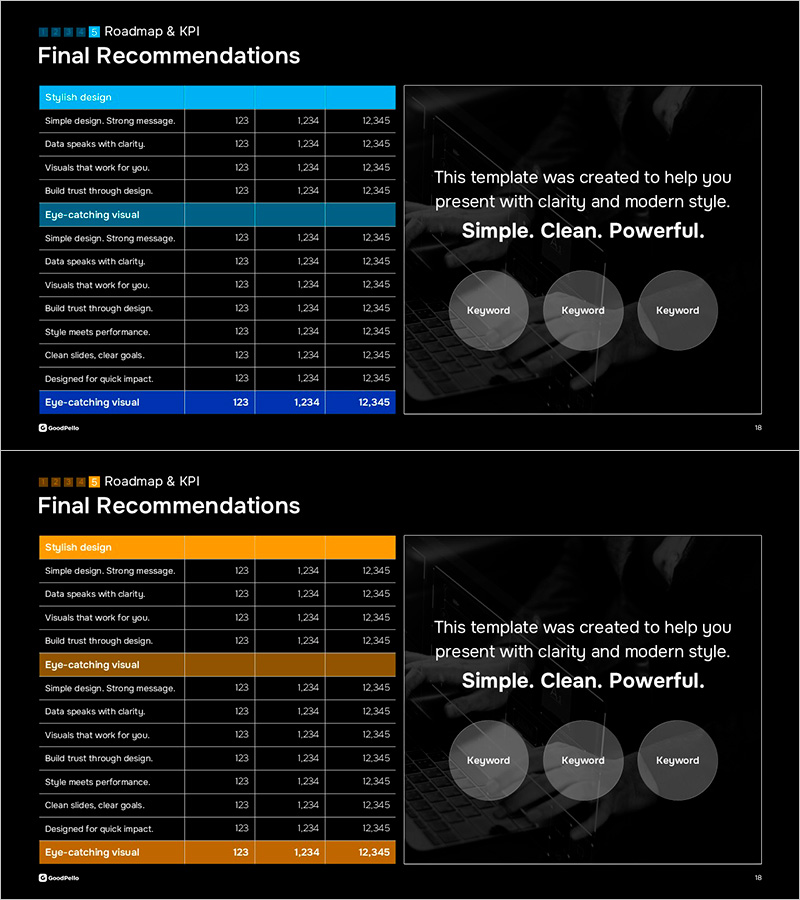
A horizontal table diagram PowerPoint slide designed to visualize final security strategy and recommendations. This 2-slide set features a dark background with a blue-header table on the first slide and an orange-header table on the second, each containing 5 columns and 11 rows of structured data (item names with three numeric columns: 123, 1,234, 12,345). The layout clearly presents operational plans, performance metrics, budget allocations, and comparative analysis. Delivered in 16:9 widescreen PPTX format, fully editable and ready for corporate reports, strategic presentations, financial analyses, and executive briefings.
Usage Points
-
Main Usage
Organizes quantitative data in a structured row-and-column format to enable clear numerical comparison across items. Ideal for security strategies, operational plans, performance metrics, budget breakdowns, and marketing analytics. Two color options (blue and orange headers) allow selection based on presentation context and emphasis.
-
How to Use
Replace item names and numeric values with your own data. Select header color (blue or orange) to match your presentation theme or highlight intent. Duplicate existing rows to expand the table if additional items are needed. Maintain consistent number formatting and alignment for professional appearance.
-
Recommended For
Finance teams, executives, project managers, and marketing professionals presenting quarterly reports, strategy meetings, investor pitches, and performance analyses. Particularly effective for data-driven decision-making in corporate meetings, client proposals, and academic presentations requiring credible information delivery.
-
Slide Structure
2-slide set. Slide 1: Dark background with blue-header table (5 columns × 11 rows: item names plus 3 numeric columns). Slide 2: Orange-header table with identical structure. All cells are editable text boxes; row heights and column widths adjust to accommodate varying data volumes.
Related Products
-

Facility Management Plan Chart – Optimizing Operations and Investments
#Operational Plan #Diagram #Capital Investment Plan
-

Sleek Diagram and Bar Graph for Systematic Data Strategy
#Operational Plan #Diagram #Graph
-

Blue Orange Checklist – Diagram for Operational Planning
#Operational Plan #Diagram #Capital Investment Plan
-

Office Interior Enhancing Work Efficiency Slide
#Operational Plan #Market and Competitor Analysis #Diagram
