Blue Orange Checklist – Diagram for Operational Planning
RJ0600011_19
- Last Update 06/23/2025
- File Size 1MB
- # of Slides 2
- File Format PPTX
- Slide Ratio 16:9
- Color
Keywords
- #Content-Based Slides
- #Design-Based Slides
- #Operational Plan
- #Diagram
- #Capital Investment Plan
- #Post-Implementation Management & Maintenance
- #Table
- #Standard Table
- #16:9
- #checklist table PowerPoint
- #operational planning diagram slide
- #9-item comparison table
- #decision matrix PPT
- #quality verification checklist PowerPoint
About the Product
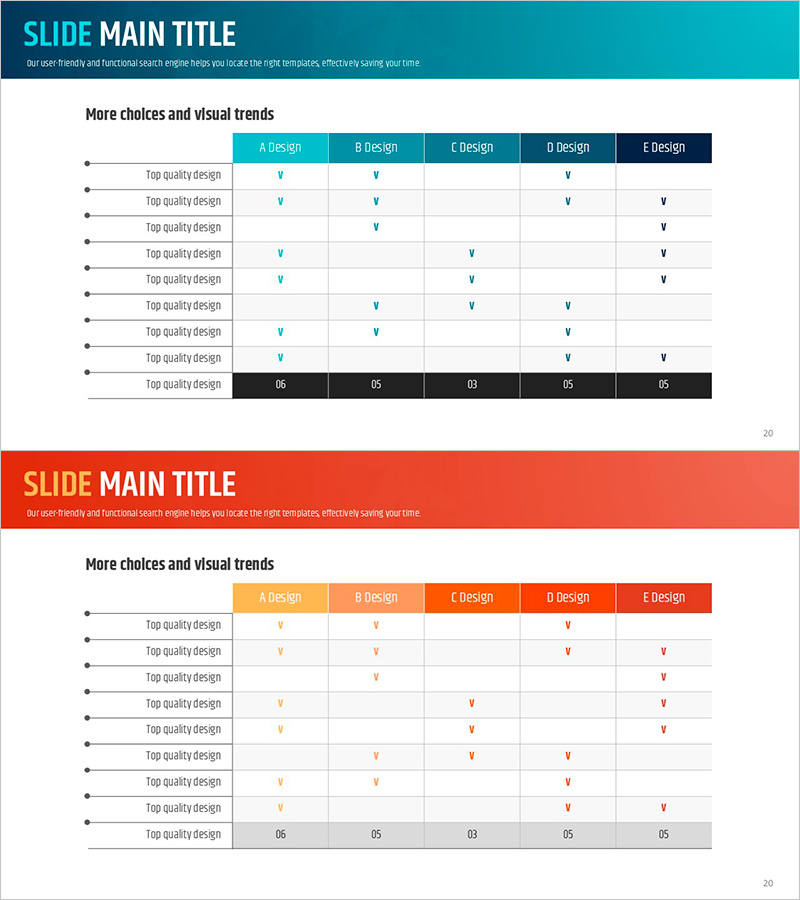
A 9-item checklist table PowerPoint slide designed for operational planning and equipment investment management. This diagram-style slide features a blue and orange two-tone color scheme with a structured table layout for visual comparison. The left side displays a black header with nine key items, while the right side presents five design options (A through E Design) with checkmark fields. This presentation slide effectively communicates decision-making processes, quality verification stages, and comparative analysis. Immediately applicable to business reports, planning documents, and executive presentations without additional formatting.
Usage Points
-
Main Usage
Organize and track essential checklist items during operational planning, equipment investment planning, and post-implementation maintenance phases. Visualizes a decision-making process by matching nine key verification items against five design options to identify optimal solutions and comparative advantages.
-
How to Use
Enter checklist item names in the left black header section, then place checkmarks (✓) in the corresponding cells under each of the five design option columns (A–E). The color contrast and checkmark placement enable quick visual comparison of option compliance, with final selection emphasis highlighting the chosen solution.
-
Recommended For
Operations managers, project planners, quality assurance professionals, equipment investment decision-makers, and executives requiring multi-option comparative analysis. Suitable for manufacturing, construction, IT, and service industry operational planning presentations, post-implementation reviews, and strategic decision documentation.
-
Slide Structure
2-slide set (16:9 aspect ratio). Header section with blue background and title, left side with 9 rows (black background + item names), right side with 5 columns (A–E Design headers + checkmark input areas). Page numbers at bottom. Four-color palette: blue, orange, black, and white.
Related Products
-

Effort and Performance Table Chart – Optimizing Operational Planning
#Operational Plan #Diagram #Capital Investment Plan
-

Facility Management Plan Chart – Optimizing Operations and Investments
#Operational Plan #Diagram #Capital Investment Plan
-

Facility Capacity and Utilization Chart – Emphasizing Operational Efficiency
#Business Introduction #Operational Plan #Diagram
-

Korean Traditional Culture Table - Emphasizing Operational Planning and Management Efficiency
#Operational Plan #Diagram #Organizational Structure and Staffing Plan
