Support Plan and Analysis Table for Operational Planning
RJ0900008_14
- Last Update 08/17/2025
- File Size 0.2MB
- # of Slides 2
- File Format PPTX
- Slide Ratio 16:9
- Color
Keywords
- #Content-Based Slides
- #Design-Based Slides
- #Operational Plan
- #Financial Plans and Performance
- #Diagram
- #Capital Investment Plan
- #Key Financial Indicators
- #Table
- #Standard Table
- #16:9
- #comparison table PowerPoint slide
- #analysis table template
- #operational planning slide
- #4x4 data table
- #business presentation template
About the Product
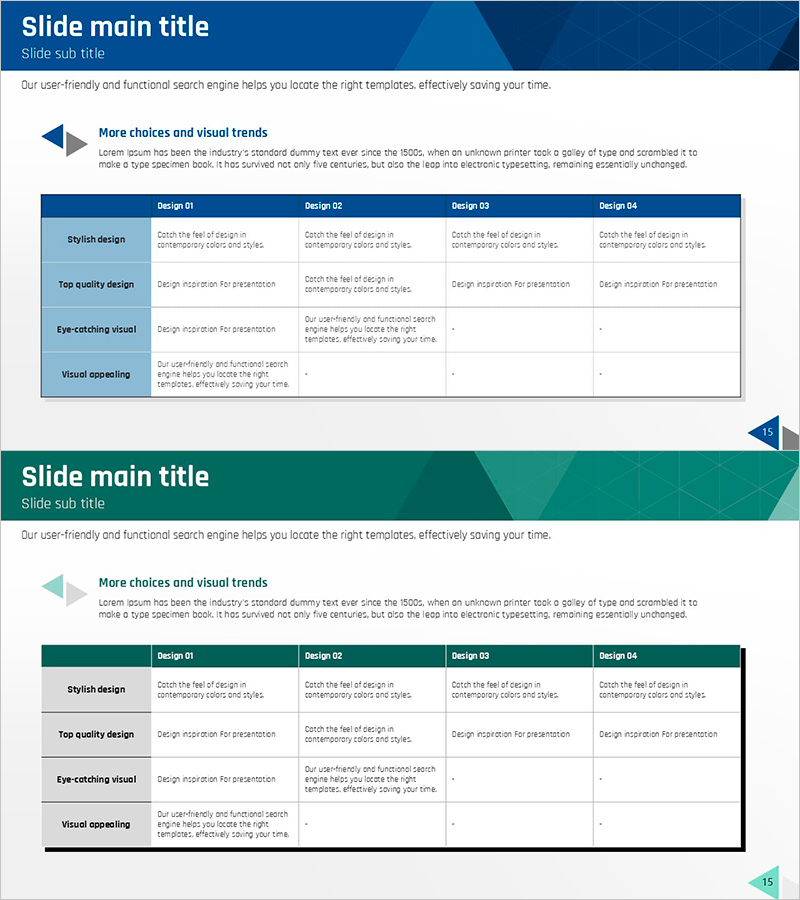
A 4-row comparison analysis table PowerPoint slide designed to systematically organize operational planning support strategies and analysis content. Featuring a dark blue header and light blue row backgrounds, this table format includes 4 columns (Design 01–04) and 4 rows (Stylish Design, Top Quality Design, Eye-Catching Visual, Visual Appealing) for cross-analysis evaluation. Each cell accommodates text input for operational strategies, financial performance, support methods, and various comparative analysis data. Ready to use immediately in presentations and business reports.
Usage Points
-
Main Usage
Optimized for cross-analyzing multiple items such as operational planning, support strategies, and financial performance using rows and columns. Enables clear comparison of organizational strategies, design criteria, and evaluation metrics at a glance.
-
How to Use
Input text into each cell to populate operational plan details, support methods, and performance indicators. Customize header row and left column labels to fit various comparative analysis topics. During presentation, clearly explain differences and characteristics of each item.
-
Recommended For
Ideal for management teams, planning departments, and operations teams reviewing operational strategies and support methods. Suitable for business plans, operational reports, and strategy presentations requiring comparative analysis of multiple proposals.
-
Slide Structure
2-slide set featuring a 4-column by 4-row table with dark blue header (Design 01–04) and row labels (Stylish Design, Top Quality Design, Eye-Catching Visual, Visual Appealing), creating 16 editable cells. Both slides maintain identical table structure with different color schemes (blue and teal).
Related Products
-

Social Network Wide Template Table – Financial Planning and Results
#Financial Plans and Performance #Diagram #Capital Requirements
-

Budget Table for Financial Analysis – Concise and Clear Data Presentation
#Financial Plans and Performance #Diagram #Budget
-

Table of Key Financial Indicators to Highlight
#Financial Plans and Performance #Diagram #Income Statement
-

Key Financial Indicators Table – Trust and Professionalism
#Financial Plans and Performance #Diagram #Income Statement
