Construction Company System Chart - Business Strategy and Operation Plan
RJ0900001_6
- Last Update 08/15/2025
- File Size 0.2MB
- # of Slides 2
- File Format PPTX
- Slide Ratio 16:9
- Color
Keywords
- #Content-Based Slides
- #Design-Based Slides
- #Business Strategy
- #Operational Plan
- #Diagram
- #Implementation Framework
- #Capital Investment Plan
- #Flow
- #Table
- #Linear Flow
- #Standard Table
- #16:9
- #linear timeline table PowerPoint
- #3-stage process diagram
- #construction strategy presentation
- #business roadmap slide
- #timeline table PowerPoint slide template
About the Product
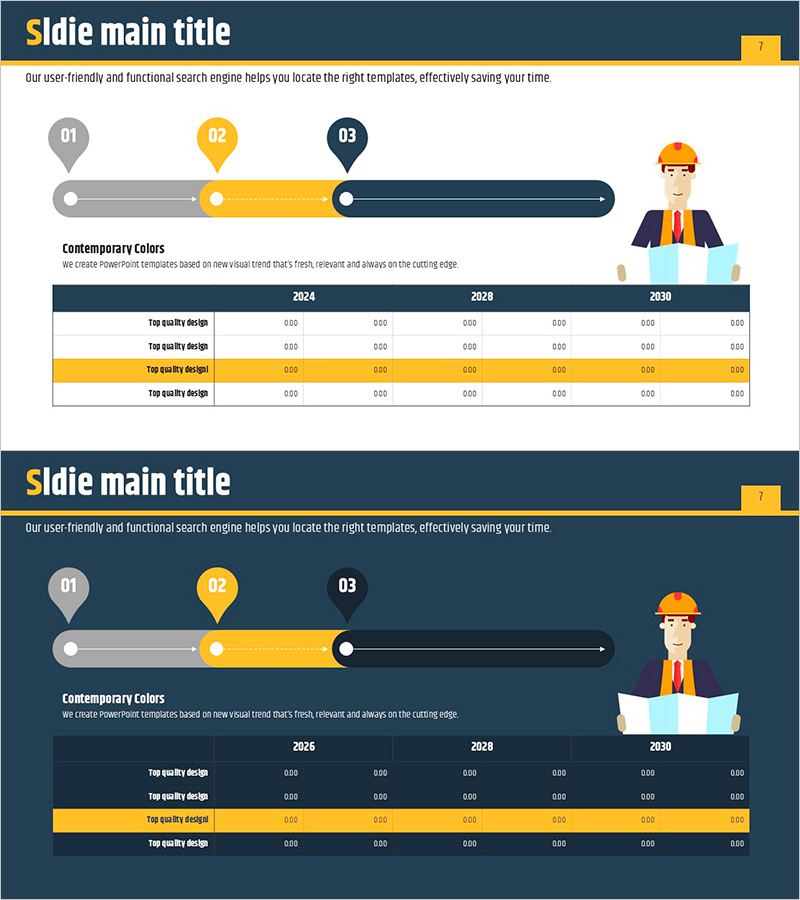
A 3-stage linear timeline table PowerPoint slide designed to visualize construction company business strategy and operational planning. Featuring a dark blue background with yellow accent colors across 2 slides, this presentation template clearly organizes stage-by-stage objectives and execution items. Pin markers and connecting lines represent process flow, while the bottom table allows input of year-by-year performance metrics. This ready-to-use PowerPoint slide deck is ideal for mid-term strategy presentations, investor briefings, and internal reporting in the construction and real estate sectors.
Usage Points
-
Main Usage
Optimized for construction and real estate companies to visually present mid-term business strategies, project timelines, and phased operational plans while organizing year-by-year performance indicators. Suitable for executive reports, investor presentations, and employee training materials.
-
How to Use
Enter stage objectives and key activities in the upper timeline, then input year-by-year quantitative metrics (revenue, contracts, completed projects, etc.) in the lower table. Customize pin marker colors and background to match your company brand identity.
-
Recommended For
Ideal for construction and real estate company executives, business development teams, project managers, and investor relations professionals presenting strategic plans and performance reports. Recommended for mid-term business planning, new project proposals, and quarterly performance review presentations.
-
Slide Structure
2-slide layout. Slide 1: Dark blue background with 3 pin markers and connecting lines forming a linear timeline, with text input areas for each stage. Slide 2: Same timeline plus a 3-year × 4-item table at bottom (with yellow accent row). 16:9 aspect ratio, PPTX format.
Related Products
-

Schedule and Review Plan Diagram – Effective Business Execution
#Business Strategy #Business Management #Diagram
-

Effort and Performance Table Chart – Optimizing Operational Planning
#Operational Plan #Diagram #Capital Investment Plan
-

Blue Orange Checklist – Diagram for Operational Planning
#Operational Plan #Diagram #Capital Investment Plan
-

Business Promotion System Diagram – Emphasizing Strategic Steps
#Product/Service Introduction #Business Strategy #Diagram
