Business Model Structure – Visualization of Service Operations
RM0800010_5
- Last Update 10/08/2025
- File Size 0.4MB
- # of Slides 2
- File Format PPTX
- Slide Ratio 16:9
- Color
Keywords
- #Content-Based Slides
- #Design-Based Slides
- #Technical Approach
- #Diagram
- #Service Operation Plan
- #Service Implementation Plan
- #Flow
- #Cluster
- #Circular Flow
- #Closed Cluster Diagram
- #16:9
- #closed-loop diagram PowerPoint
- #business model structure slide
- #circular diagram template
- #6-node cluster diagram
- #service operations PowerPoint
- #business model visualization slide
About the Product
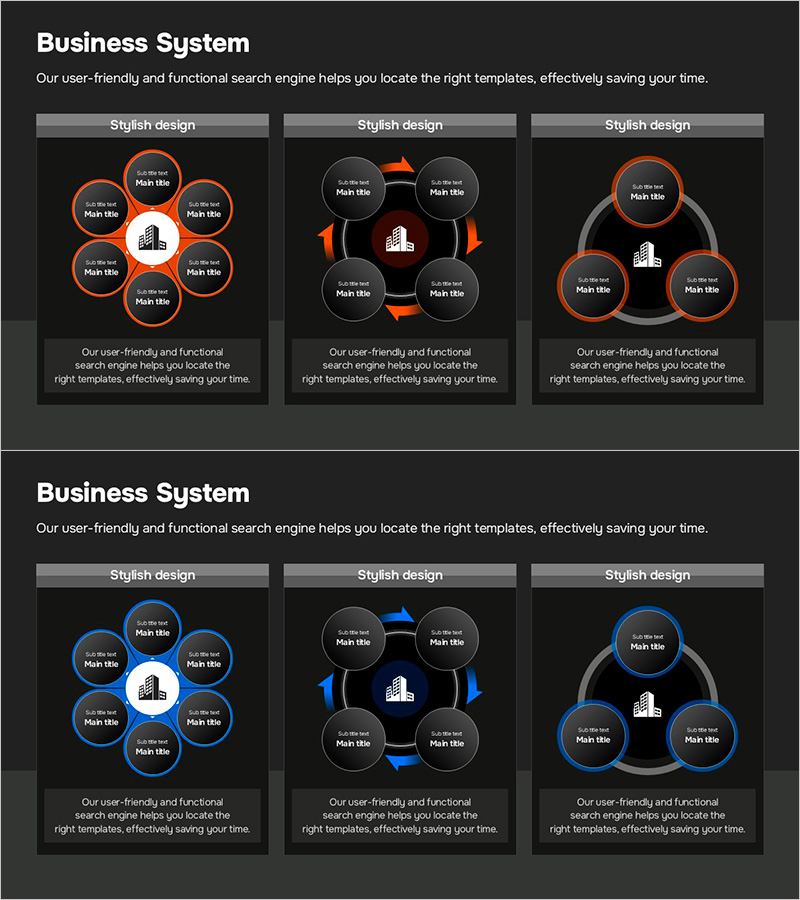
A closed-loop business model diagram PowerPoint slide that visualizes service operations and business relationships. The design features a central core element surrounded by six interconnected nodes arranged in a circular structure, available in three color schemes: orange, black, and blue. Each node provides an independent text input area for customizing organizational departments, service stages, business components, or operational elements. The 2-slide set includes multiple layout variations, optimized for 16:9 widescreen format to suit modern presentation environments. Delivered in fully editable PPTX format, enabling quick customization and reducing presentation preparation time significantly.
Usage Points
-
Main Usage
Optimized for expressing business model core elements and their interdependencies using a centralized hub-and-spoke structure. Effectively visualizes service operations, organizational hierarchies, process flows, and business ecosystems by clearly showing how peripheral elements connect to and support the central concept.
-
How to Use
Input department names, service stages, business components, or operational elements into each node's text area. Replace the central building icon with relevant imagery matching your business context. Select from three color-coded slide variations to align with your presentation theme and corporate branding.
-
Recommended For
Executive briefings, business strategy presentations, organizational structure explanations, service operation planning meetings, investor pitch decks, consulting proposals, startup pitches, business plan presentations, and organizational restructuring announcements. Ideal for communicating complex business models and operational frameworks to stakeholders.
-
Slide Structure
Two-slide set featuring three color scheme variations: orange accent lines, black background with white elements, and blue accent lines. Each slide displays a central building icon surrounded by six circular nodes in symmetrical arrangement, connected by directional arrows indicating circular relationships. Optimized for 16:9 widescreen format for contemporary presentation standards.
Related Products
-

Presentation Template Emphasizing Visual Appeal - The Power of Visual Elements
#Technical Approach #Diagram #Service Operation Plan
-

Automobile Management Service System – Efficient Operation Strategy
#Technical Approach #Diagram #Service Operation Plan
-

Airplane Circulation Diagram – Efficient Operation Planning
#Operational Plan #Technical Approach #Diagram
-

Circular Three-Sector Model Slide – Clarifying Service Operations
#Technical Approach #Diagram #Service Operation Plan
