Modern Grid Business Report Template - Sleek and Intuitive Design
M0800010
- Last Update 03/03/2025
- File Size 112.2MB
- # of Slides 21
- File Format PPTX
- Slide Ratio 16:9
- Color
Slide Preview


Keywords
About the Product
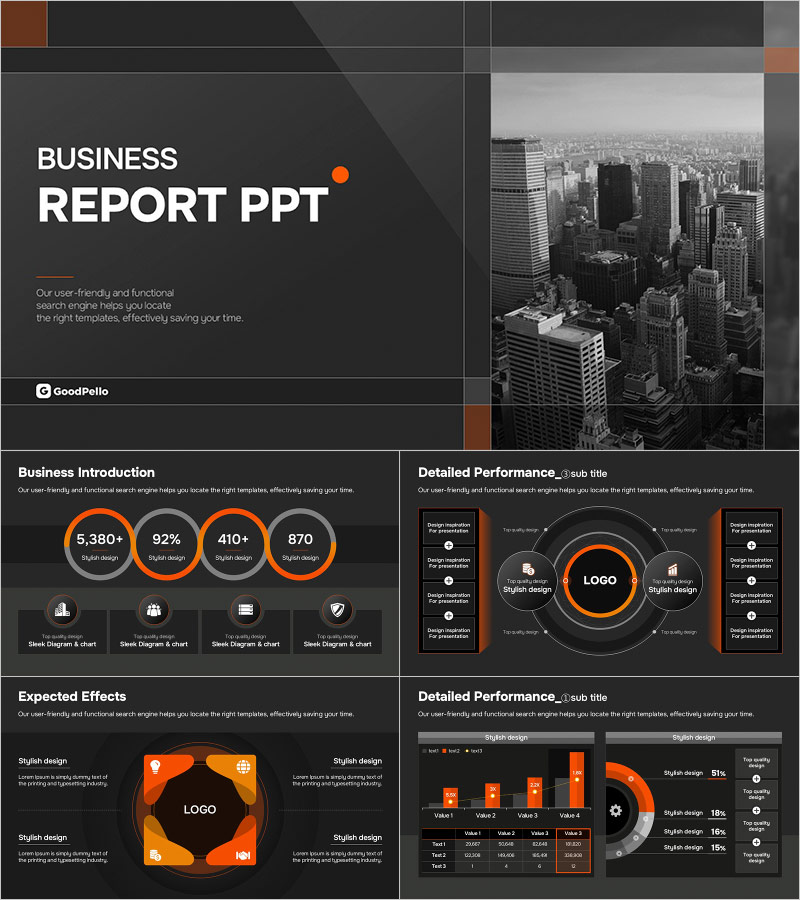
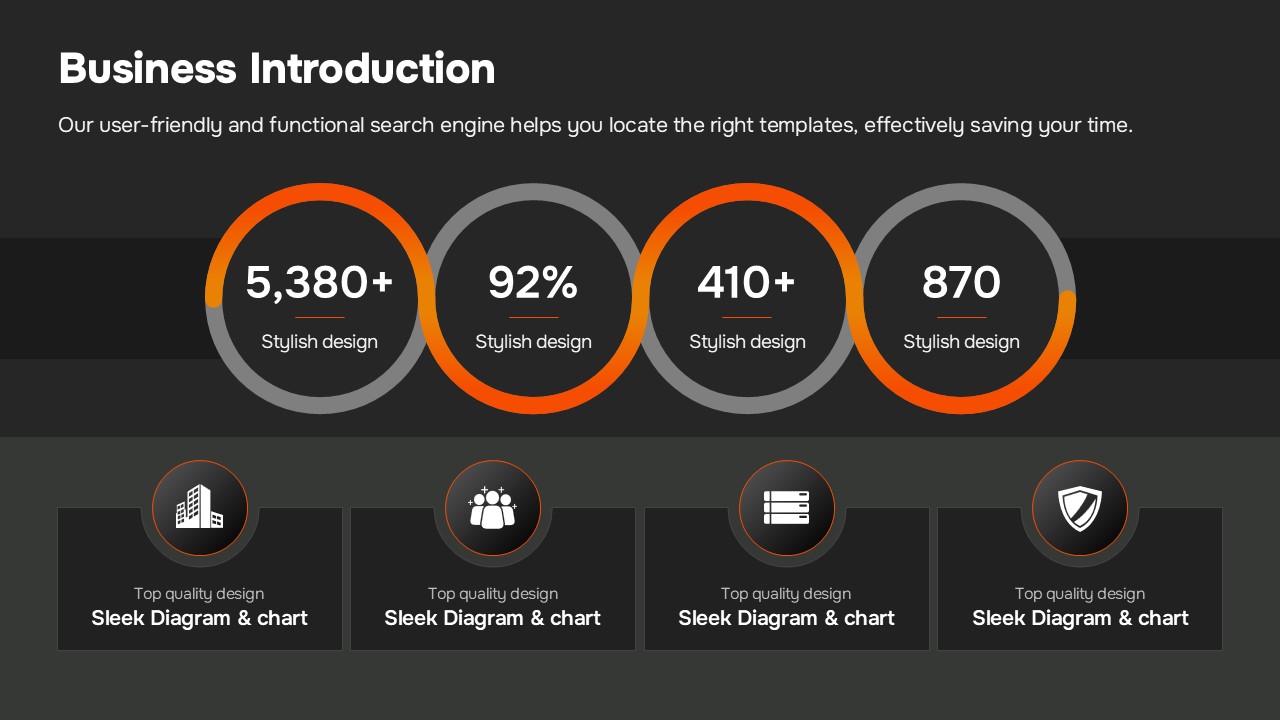
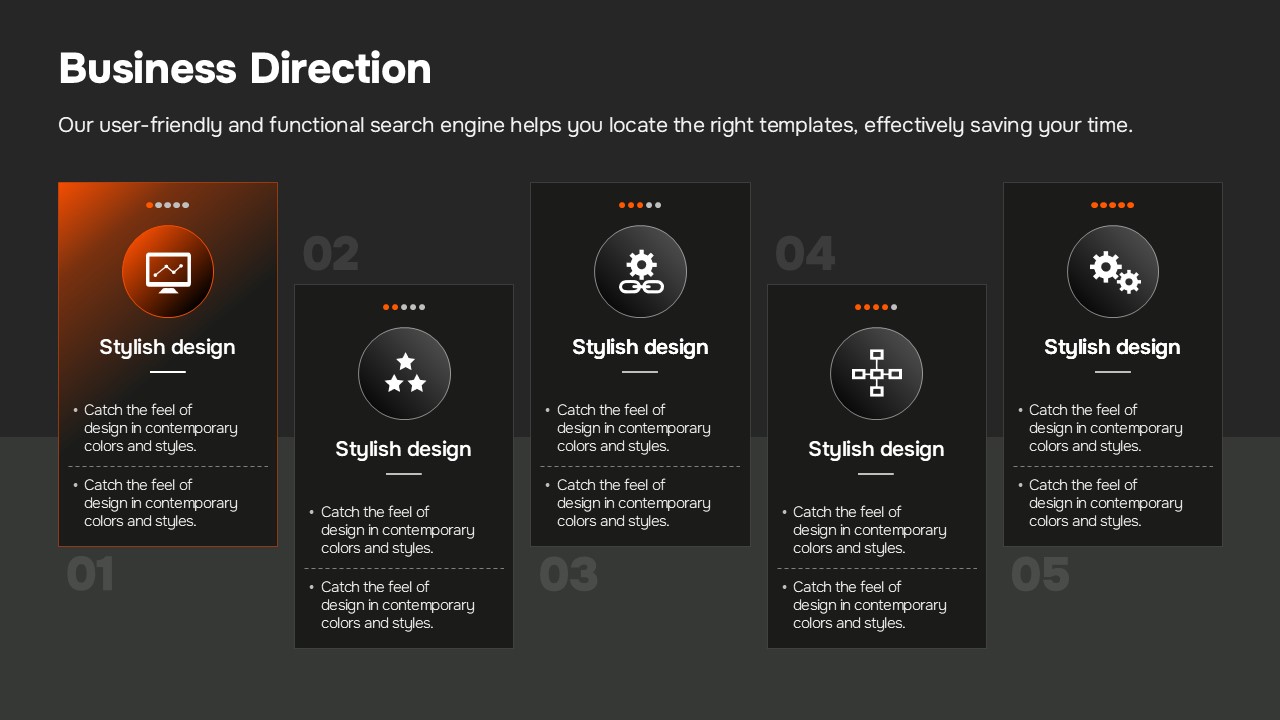
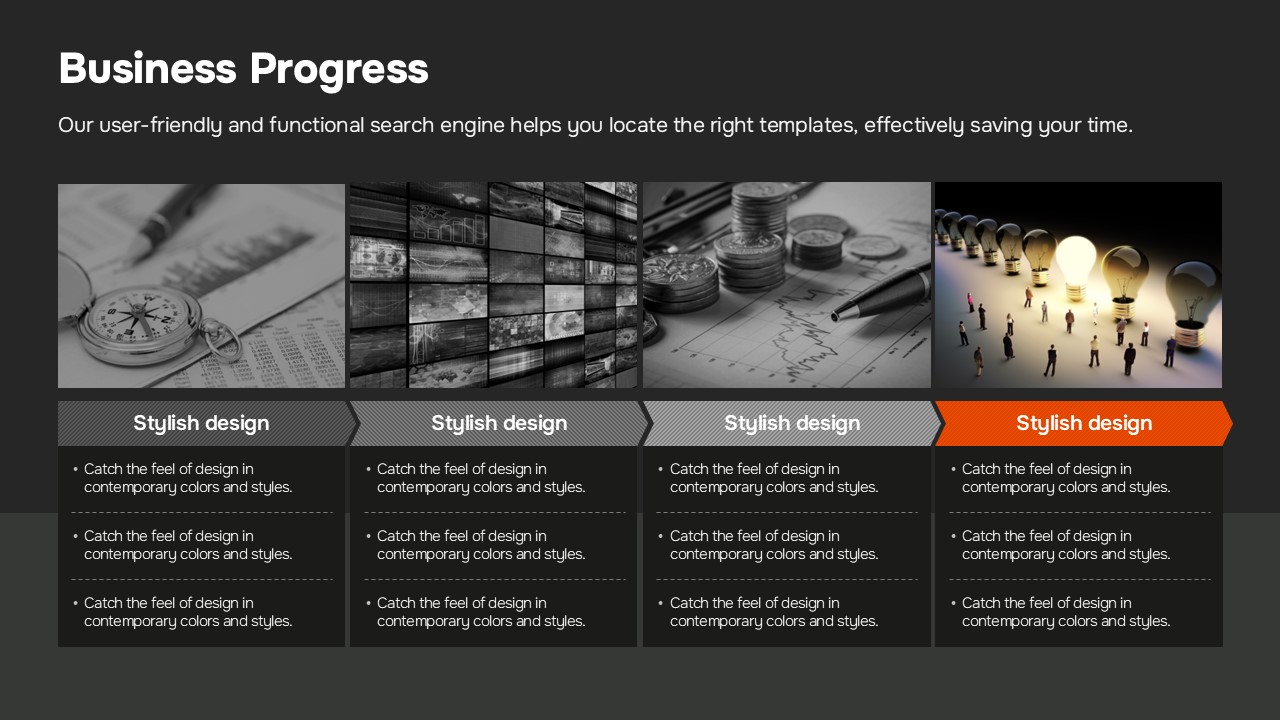
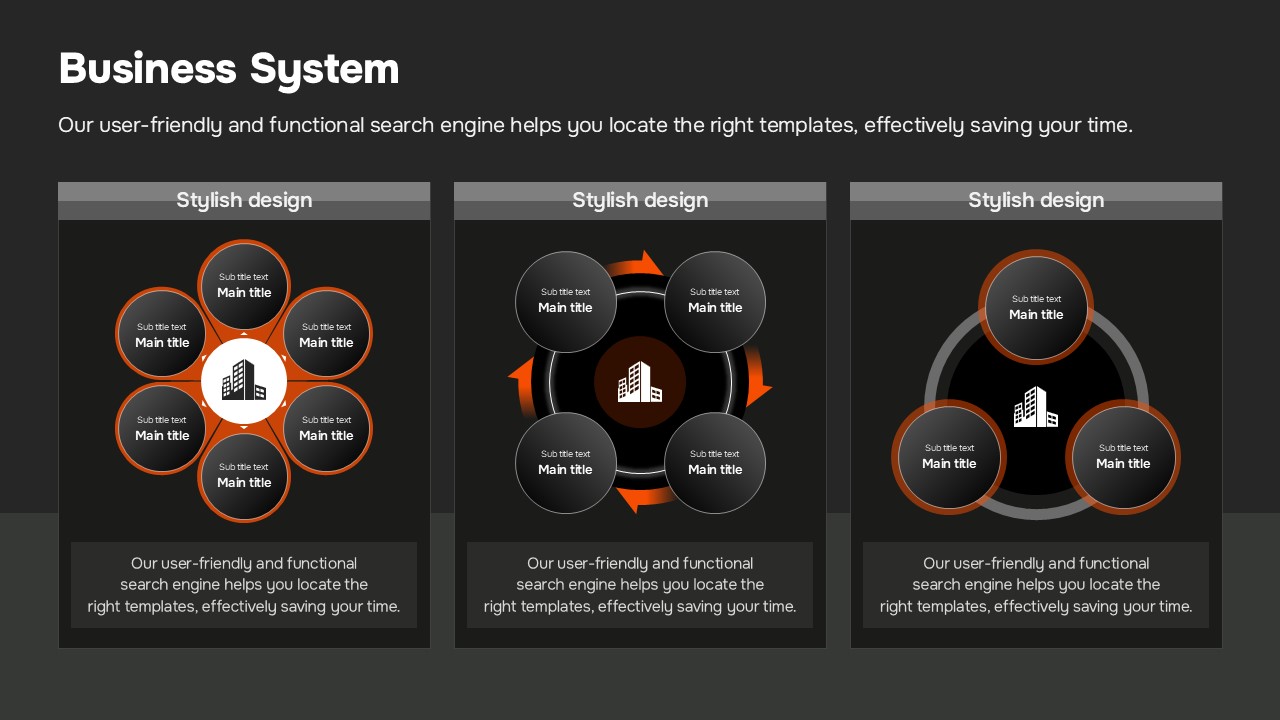
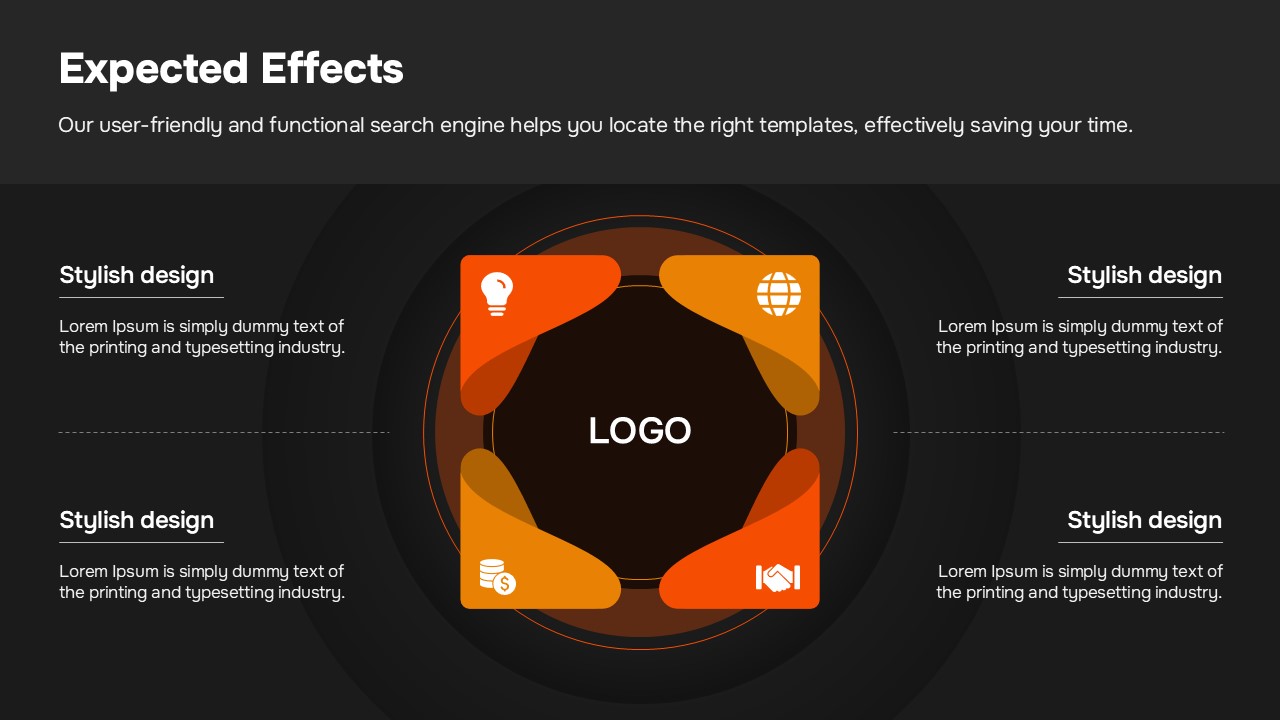
A professional 21-slide business report PowerPoint template built on a dark charcoal background with orange accent colors and white typography. This presentation covers the full standard structure of a business performance report: cover slide, business introduction with KPI highlight cards, detailed performance analysis with circular cluster diagrams, action plan slides with a semi-circular 5-point diagram, and a future action plans grid. The two-column grid layout and numbered section system (①②) create clear information hierarchy throughout the deck. Data visualization elements include KPI metric cards, circular cluster diagrams, vertical bar charts, and a 5-column grid table — making it easy to present performance data with visual impact. Simply replace the placeholder content with your actual figures and strategies to produce a polished, submission-ready PPTX file for executive briefings, quarterly reviews, or investor updates.
Usage Points
-
Main Usage
Designed to present business performance data in a structured, visually compelling format for executive briefings, quarterly or annual performance reviews, and investor update presentations.
-
How to Use
Enter your company name and reporting period on the cover slide, replace KPI card figures and chart data with your actual performance numbers, then fill in the action plan and future plans slides with your strategic initiatives to complete the deck.
-
Recommended For
Ideal for business planning teams, strategy managers, IR professionals, and team leads or executives who need to present quarterly results or annual performance reports to leadership or investors.
-
Slide Structure
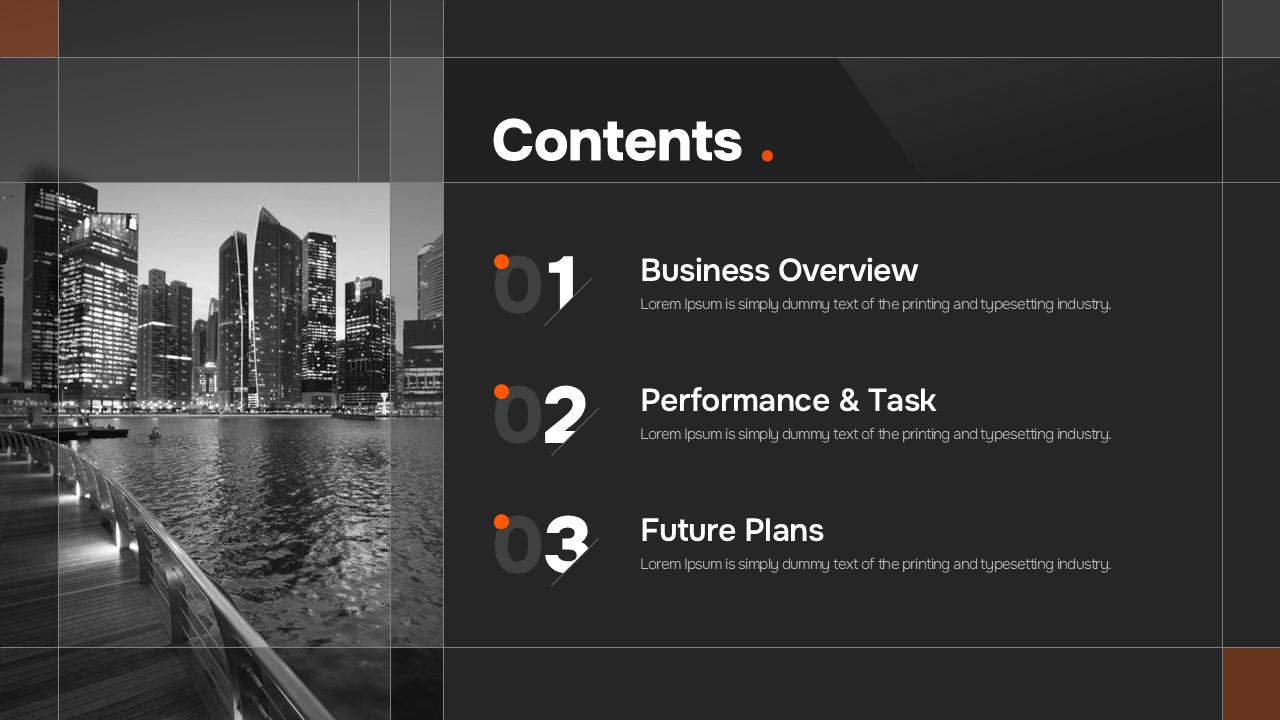
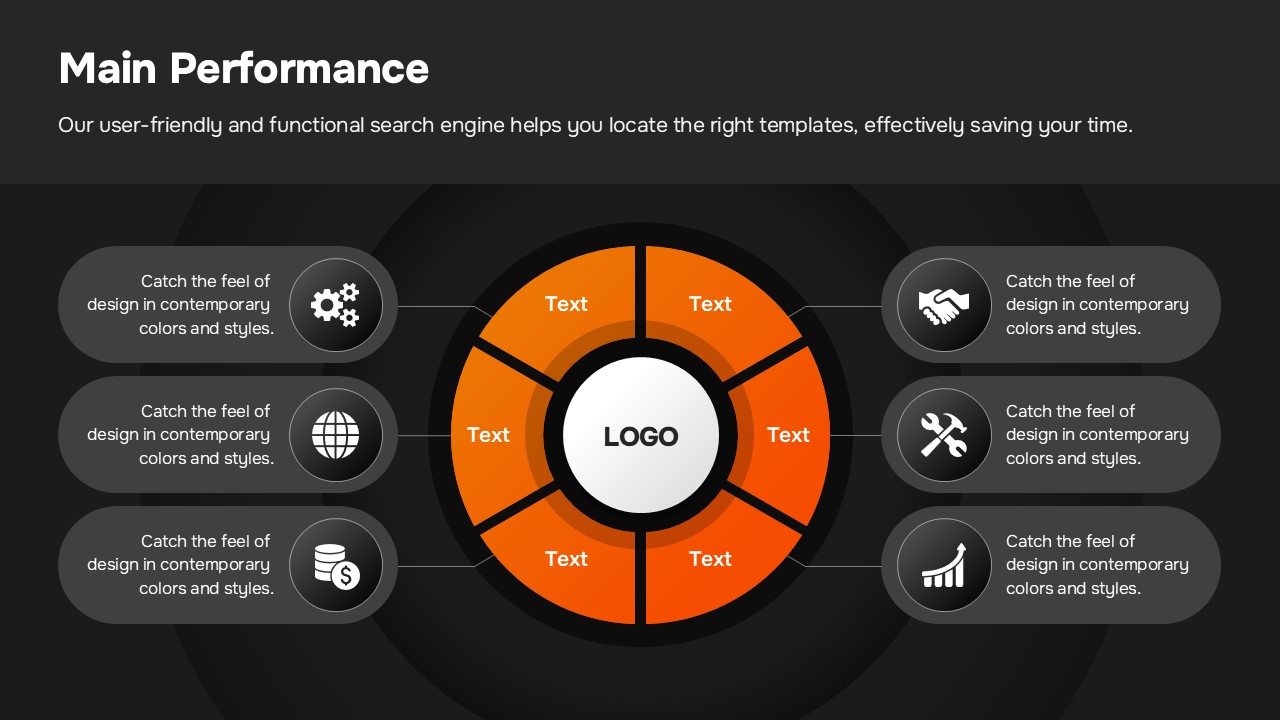
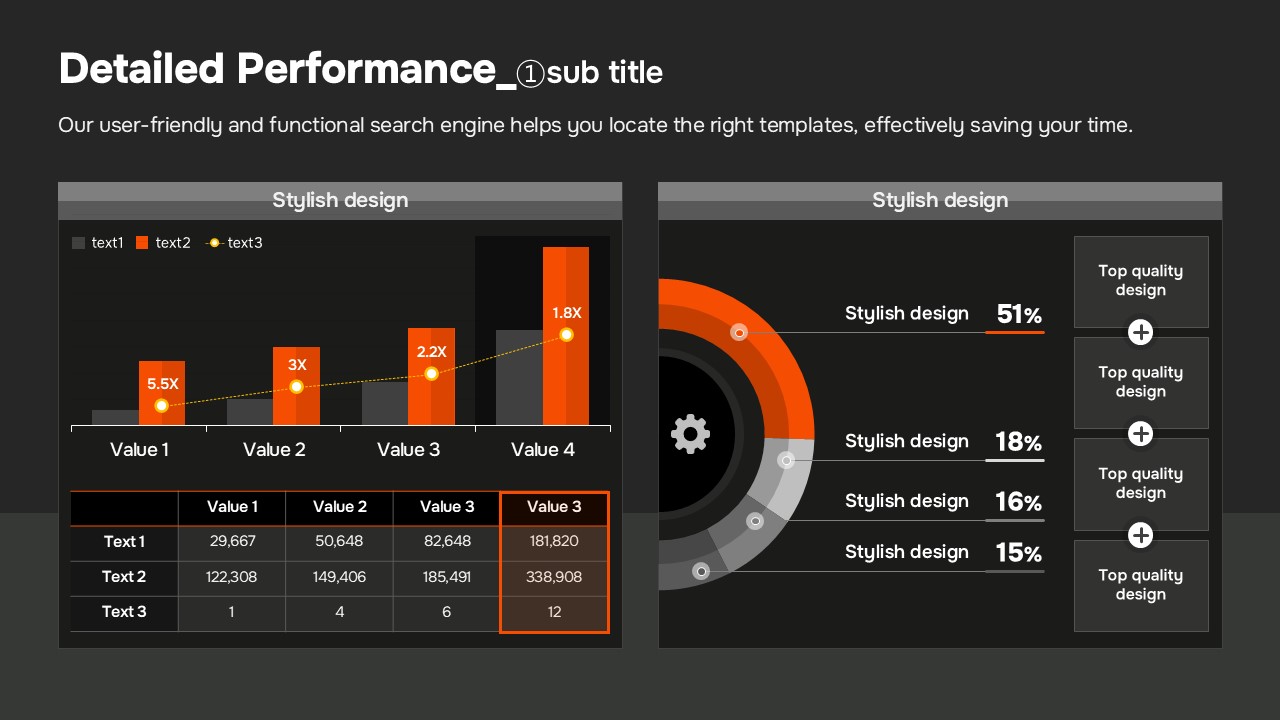
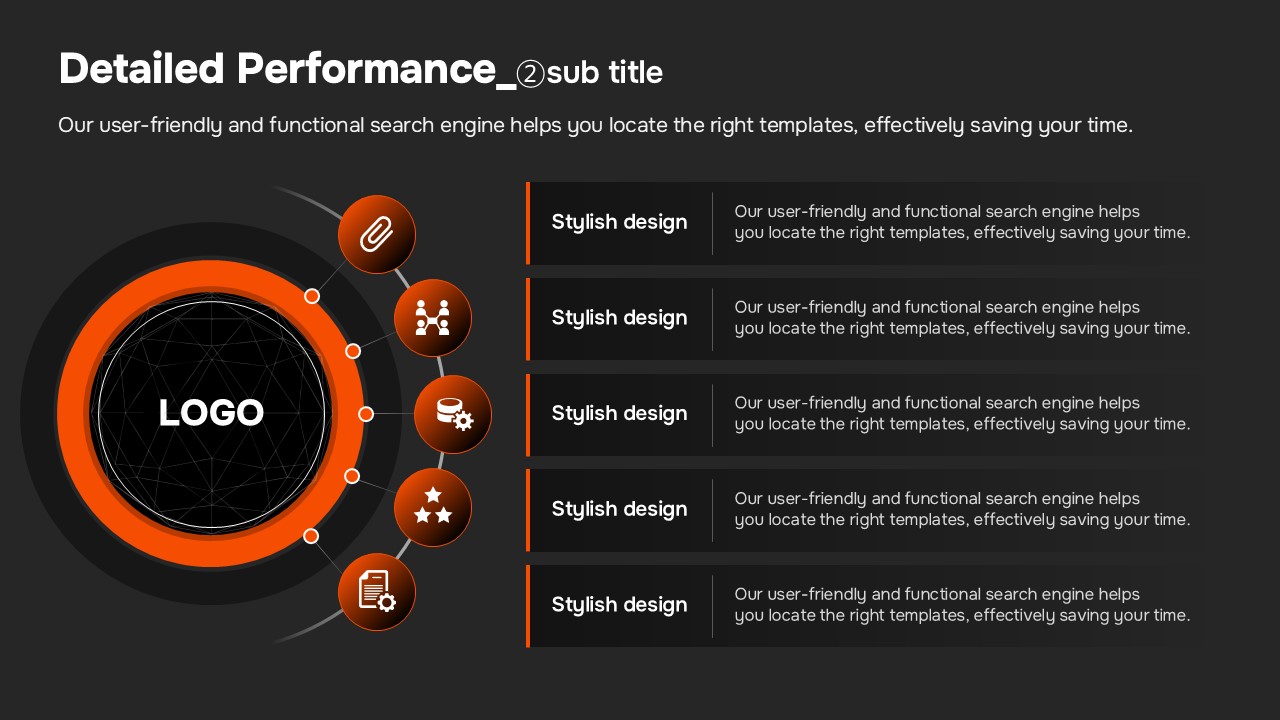
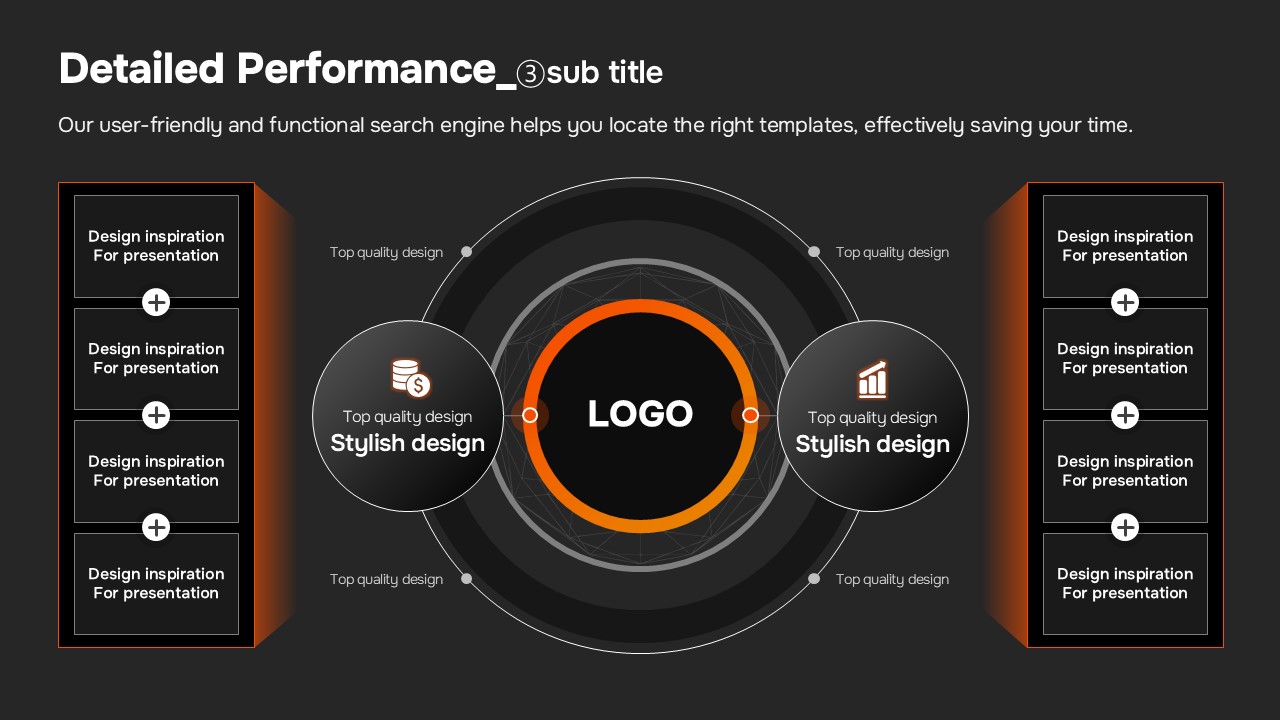
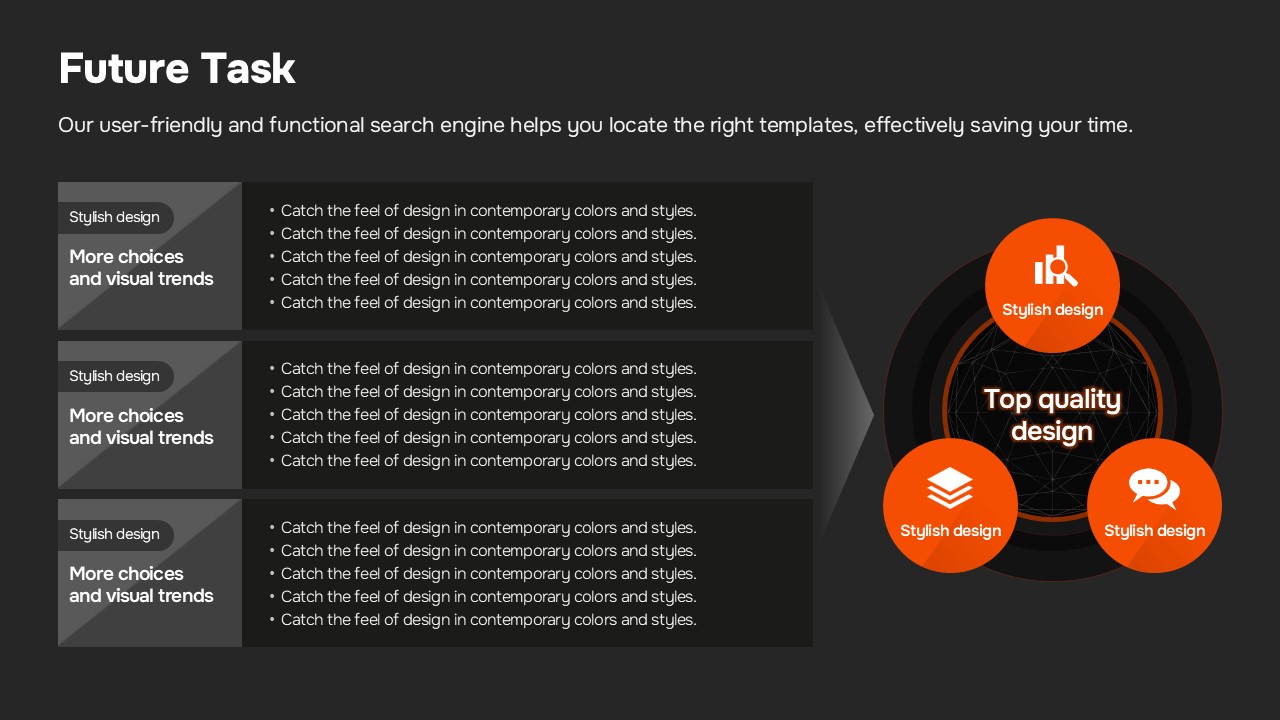
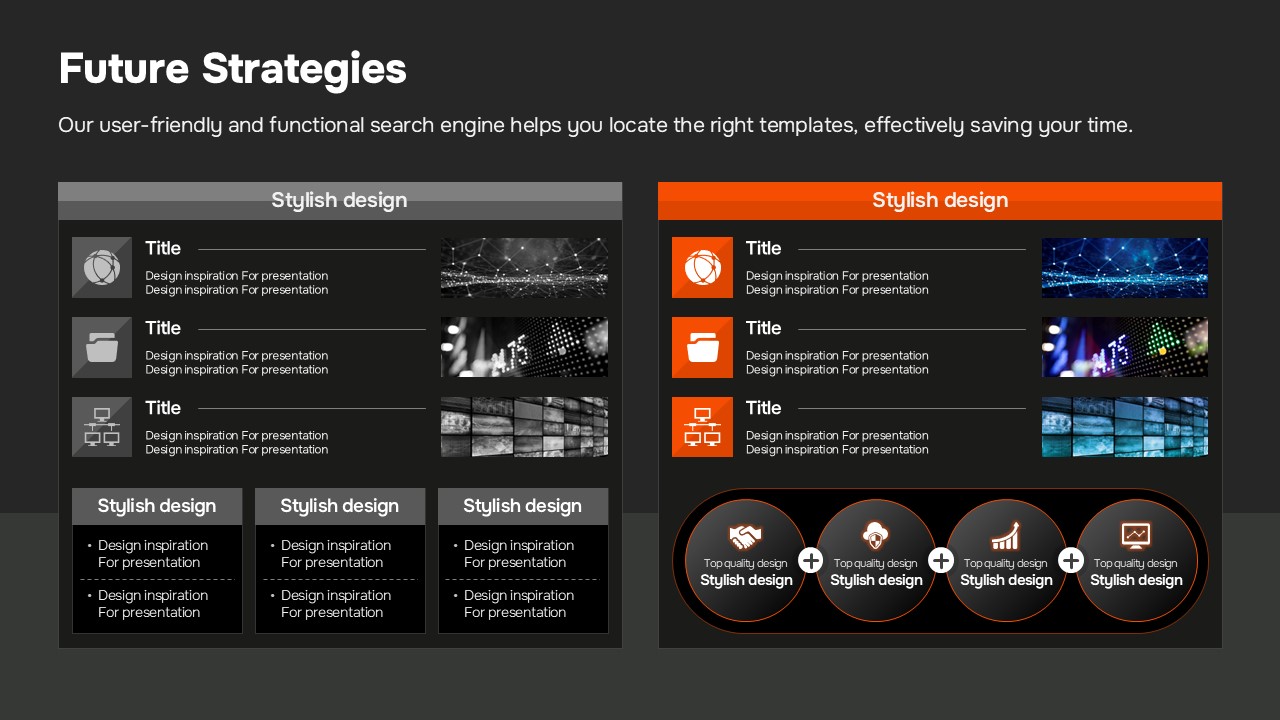
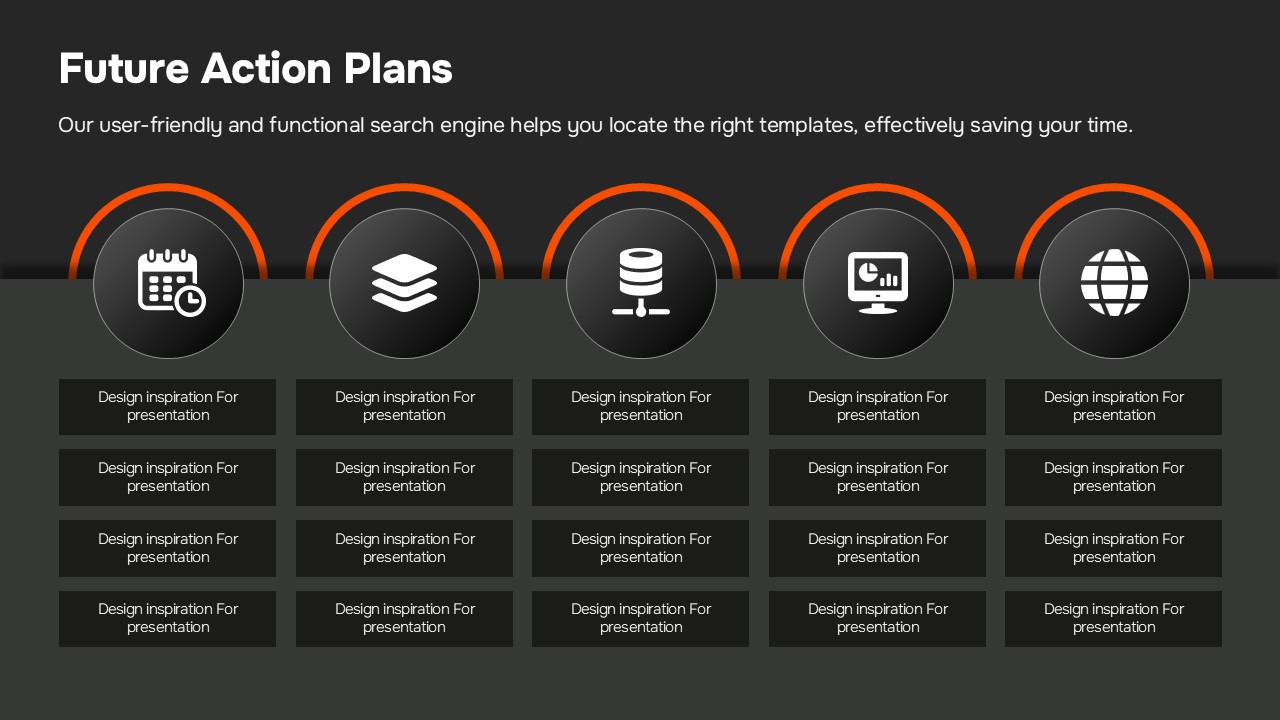
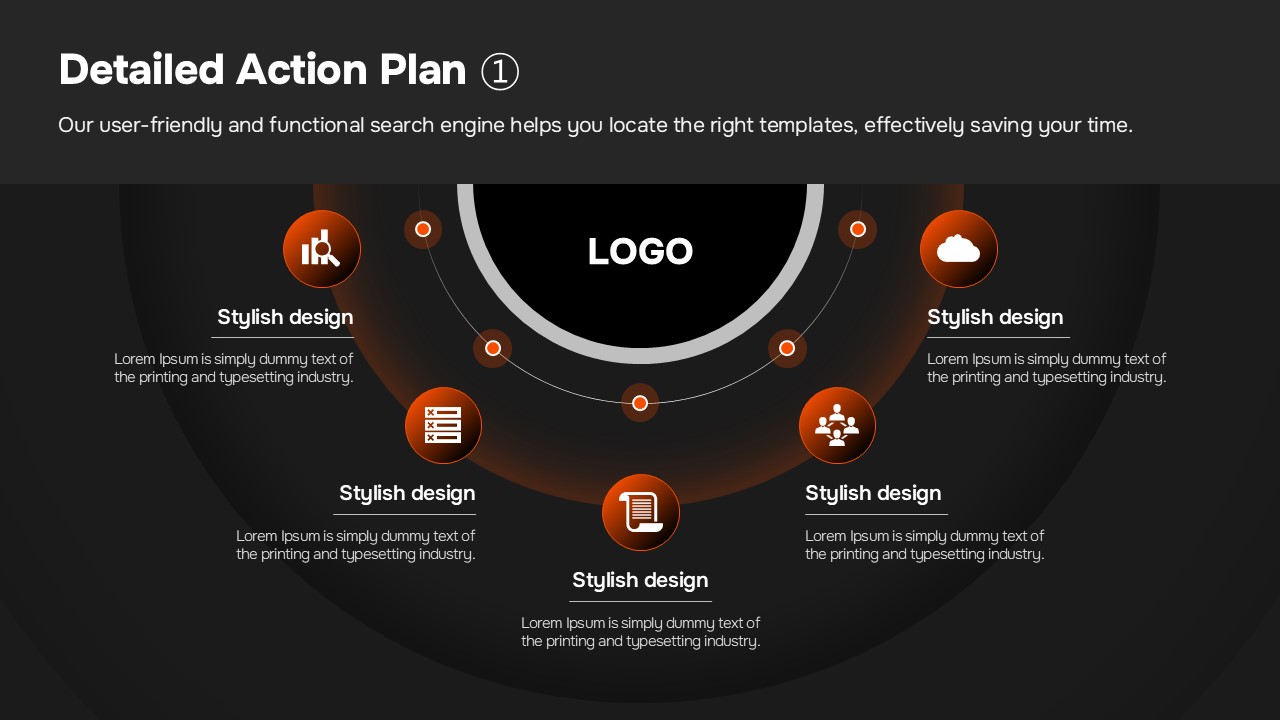
21 slides total: Cover (Business Report) → Business Introduction (4 KPI metric cards + 4 icon blocks) → Detailed Performance ① (circular cluster diagram + list) → Detailed Performance ② (circular connection diagram + 5-item list) → Detailed Action Plan ① (semi-circular 5-point diagram) → Future Action Plans (5-column icon grid + table) — structured to follow a standard business performance reporting flow
Related Products
-

Business Report PowerPoint Template – Green & Black Simple Design
#Business/Performance Report
-

Pet Goods Store Business Report PowerPoint Template - Vibrant Design
#Business/Performance Report
-

Business/Performance Report Template – Professional and Sleek Design
#Business/Performance Report
-

Financial Industry Trend & Strategy Report Template – Clean and Modern Design
#Business/Performance Report
