Natural Environment Expected Effect Diagram – Service Operations
RJ0600020_9
- Last Update 06/26/2025
- File Size 0.7MB
- # of Slides 2
- File Format PPTX
- Slide Ratio 16:9
- Color
Keywords
- #Content-Based Slides
- #Design-Based Slides
- #Technical Approach
- #Diagram
- #Service Operation Plan
- #Service Implementation Plan
- #Cluster
- #Closed Cluster Diagram
- #Chain Diagram
- #16:9
- #circular diagram PowerPoint
- #node connection slide
- #cyclic structure presentation
- #4-step diagram
- #bidirectional arrow PowerPoint slide
About the Product
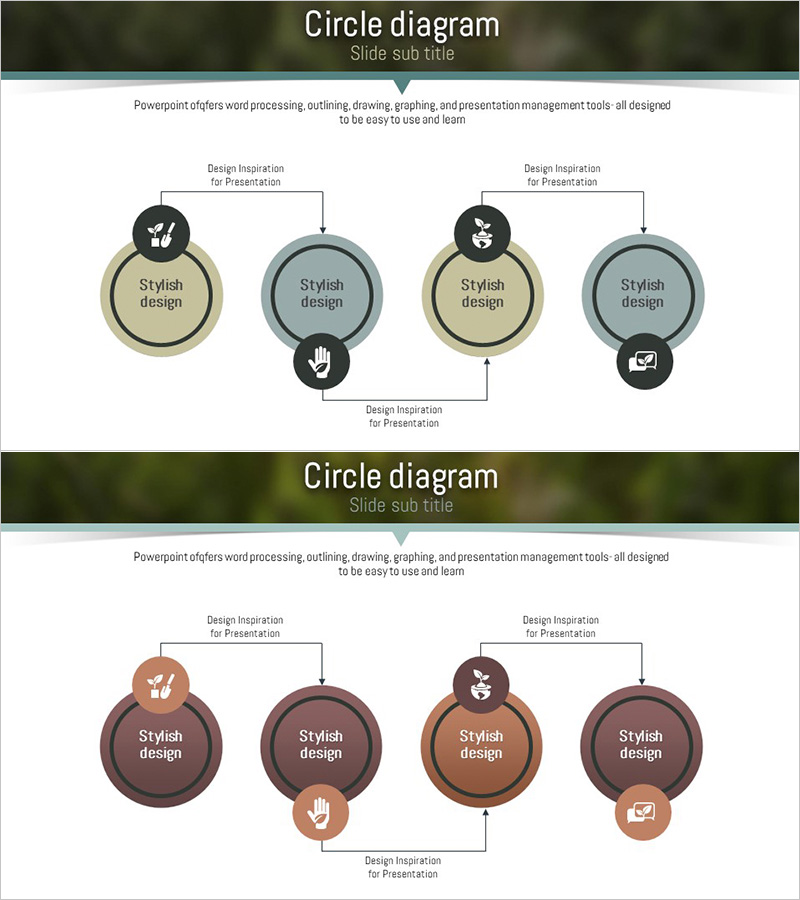
A PowerPoint slide featuring four circular nodes connected by bidirectional arrows in a cyclic structure. The design offers two layout variations with warm color palettes—beige and gray tones, and brown and copper tones—each node includes an icon placeholder and text input area for customization. Ideal for visualizing service operations, expected outcomes, process cycles, and interdependent relationships. Delivered in 16:9 widescreen PPTX format, fully editable and ready to integrate into presentations, reports, and strategic proposals where circular workflows and mutual connections need emphasis.
Usage Points
-
Main Usage
Visualizes bidirectional relationships and cyclic structures among four key elements such as service operations, expected outcomes, process stages, and interdependencies. Each node's icon and text area enable clear communication of step-by-step explanations, role definitions, and interaction patterns.
-
How to Use
Enter title, description, and icon in each circular node. Adjust arrow direction and colors as needed. Select between two color schemes (beige-gray or brown-copper tones) to match your presentation theme. Use the slide master to batch-update colors and fonts across all instances.
-
Recommended For
Perfect for business plans, proposals, and reports explaining operational processes, expected benefits, and service workflows. Marketing, strategy, and operations professionals can use it to emphasize cyclic structures and interdependencies. Also suitable for educational and seminar materials illustrating learning stages and feedback loops.
-
Slide Structure
2-slide set. Each slide contains a title area at the top and four circular nodes (approximately 80px diameter) arranged in a rectangular grid at the bottom, connected by bidirectional arrows (2pt line weight). Each node includes an icon placeholder (16×16px) and text input area (approximately 60 characters). White background with generous margins and minimal layout design.
Related Products
-

Round Circular Block Diagram – Analysis of Technical Sector Service Operations
#Technical Approach #Diagram #Service Operation Plan
-

Accommodation Slide for Travel – Cluster Diagram Design
#Technical Approach #Diagram #Service Operation Plan
-

Automobile Management Service System – Efficient Operation Strategy
#Technical Approach #Diagram #Service Operation Plan
-

Halloween Connection Diagram – Creative Service Operations
#Technical Approach #Diagram #Service Operation Plan
