Future Outlook Segmented Bar Graph – Essential Slide for Market Analysis
RJ0400072_11
- Last Update 06/07/2025
- File Size 0.3MB
- # of Slides 2
- File Format PPTX
- Slide Ratio 16:9
- Color
Keywords
- #Content-Based Slides
- #Design-Based Slides
- #Market and Competitor Analysis
- #Graph
- #Text Box
- #Future Outlook
- #Market Analysis
- #Column
- #Segmented Column
- #Arrow
- #16:9
- #vertical bar chart PowerPoint
- #3-series bar graph slide
- #year-over-year data comparison
- #market analysis chart template
- #trend visualization PowerPoint slide
About the Product
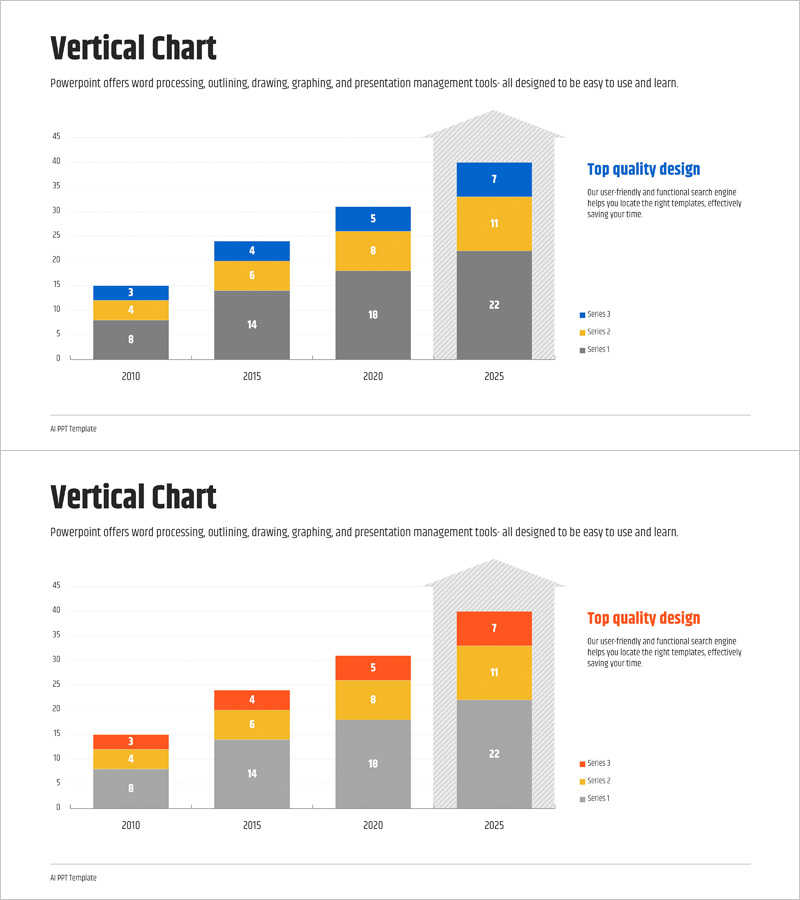
A professional vertical bar chart PowerPoint slide that visualizes multi-series data across four time points from 2010 to 2025. Three data series are distinguished by gray, yellow, and blue color coding, enabling clear year-over-year comparison of market trends, revenue growth, or performance metrics. Each bar includes segmented numerical labels for precise data reading. The slide features a legend and 'Top quality design' callout text to enhance presentation credibility. Ready to use in market analysis reports, business performance reviews, investment pitches, and strategic planning presentations.
Usage Points
-
Main Usage
This slide compares multiple data series across time periods using vertical bar heights. Ideal for visualizing market size evolution, revenue trends, customer growth, market share changes, and other quantitative performance metrics. Numerical labels and legend ensure accurate data communication while building audience confidence in your analysis.
-
How to Use
Deploy in business performance reviews, market analysis presentations, quarterly earnings calls, investor relations meetings, and strategic planning sessions to show historical trends alongside current performance. Edit bar values with your actual data and customize legend labels (Series 1, 2, 3) to match your specific metrics and business context.
-
Recommended For
Recommended for executives, business analysts, marketing teams, finance departments, and sales leaders who need to present quantitative data comparisons. Particularly effective for quarterly or annual performance reviews, competitive benchmarking, market size analysis, and growth trajectory discussions. Applicable across business plans, investor pitch decks, executive reports, and marketing strategy documents.
-
Slide Structure
Two-slide set. First slide displays 3-series vertical bars in blue, yellow, and gray across 2010, 2015, 2020, and 2025 data points. Second slide repeats the same structure with orange, yellow, and gray color variation for design flexibility. Both slides include Y-axis scale (0–45), legend, and right-aligned emphasis text box.
Related Products
-

Visualization of Learning Response Data – Market Trend Analysis
#Market and Competitor Analysis #Graph #Future Outlook
-

Cartoon Theme Vertical Bar Segmentation Graph – Vision and Growth
#Market and Competitor Analysis #Graph #Future Outlook
-

Graph of Changes in Media Utilization
#Market and Competitor Analysis #Graph #Future Outlook
-

Visualizing the Changing Trend of the Ageing Population with a 100% Stacked Bar Graph
#Business Strategy #Market and Competitor Analysis #Marketing Plan and Strategy
