Cartoon Theme Vertical Bar Segmentation Graph – Vision and Growth
RJ0300072_22
- Last Update 05/08/2025
- File Size 0.3MB
- # of Slides 2
- File Format PPTX
- Slide Ratio 16:9
- Color
Keywords
About the Product
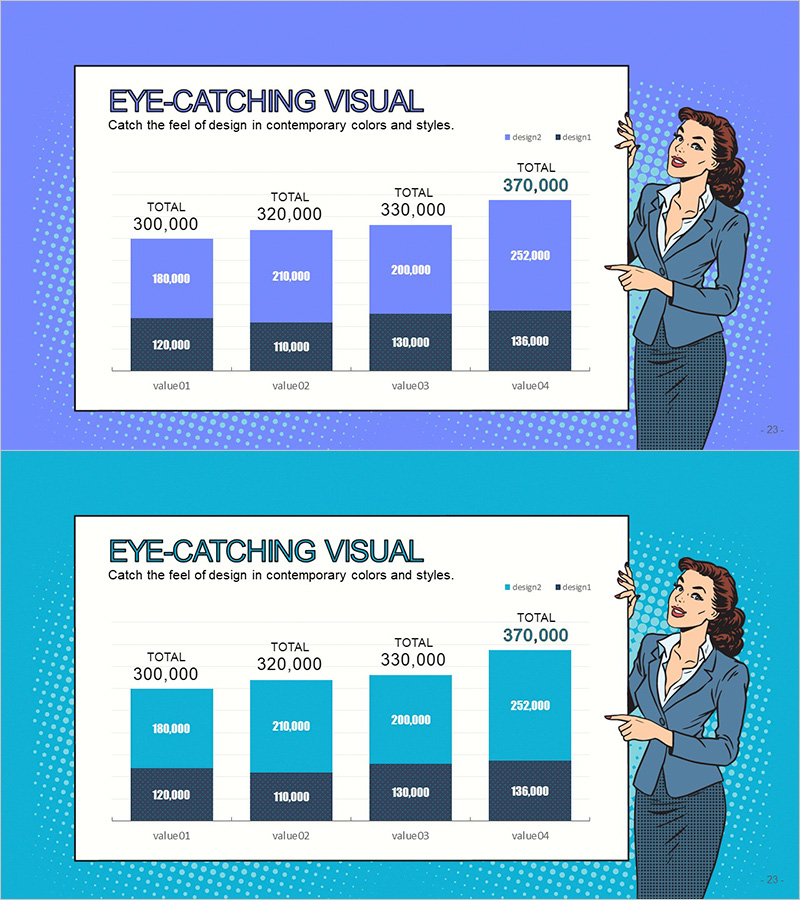
A cartoon-themed vertical bar segmentation chart PowerPoint slide featuring four data categories with two distinct series represented in contrasting colors. The design uses bright purple and dark gray to clearly differentiate data values, with total figures displayed above each bar. A cartoon character positioned on the right side adds a friendly, approachable tone to presentations. This slide template is ideal for market analysis, competitive benchmarking, growth trends, and quantitative data visualization in business presentations.
Usage Points
-
Main Usage
Visualizes quantitative data across four categories with two data series for comparative analysis. Effectively communicates market size, revenue figures, customer satisfaction scores, growth rates, and other numerical metrics to support decision-making.
-
How to Use
Replace the numerical values at the top of each bar with your actual data. Update the legend labels to match your document context. Keep the cartoon character position fixed while customizing background and bar colors to align with corporate branding guidelines.
-
Recommended For
Suitable for market analysis sections in business plans, quarterly performance reports, competitive benchmarking documents, marketing strategy presentations, and investor pitch decks. Recommended for sales teams, planning departments, finance teams, and data-driven presentations.
-
Slide Structure
Two-slide set with purple and teal background variations. Each slide contains four vertical bars (value01 through value04) with dual-series segmentation (design1 and design2), displaying both individual segment values and total figures for comprehensive data comparison.
Related Products
-

Analysis Graph of Future Prospects for Cooperative Business
#Market and Competitor Analysis #Diagram #Graph
-

Visualizing the Changing Trend of the Ageing Population with a 100% Stacked Bar Graph
#Business Strategy #Market and Competitor Analysis #Marketing Plan and Strategy
-

Visualization of Learning Response Data – Market Trend Analysis
#Market and Competitor Analysis #Graph #Future Outlook
-

Graph of Changes in Media Utilization
#Market and Competitor Analysis #Graph #Future Outlook
