Visual Slide for Pet Store Growth Achievements
RM0800009_12
- Last Update 03/01/2025
- File Size 9.8MB
- # of Slides 2
- File Format PPTX
- Slide Ratio 16:9
- Color
Keywords
About the Product
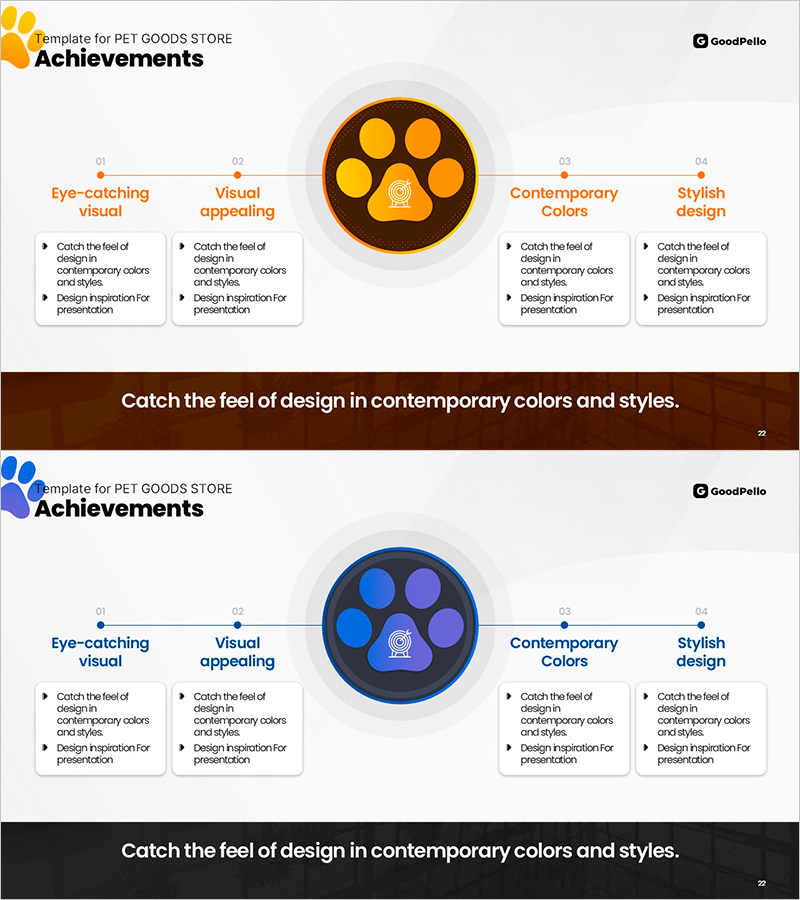
A PowerPoint slide deck that visualizes pet store growth achievements through a 5-stage circular flow structure. Designed with warm orange and brown tones, the layout features a central paw icon surrounded by five circular nodes arranged in a cycle pattern. Each stage clearly represents key performance indicators (eye-catching visuals, visual appeal, contemporary colors, stylish design) for effective presentation. Comprising 2 slides in 16:9 widescreen PPTX format, this diagram is fully editable and ready to use immediately. Optimized for pet business presentations, marketing performance reports, and brand growth storytelling.
Usage Points
-
Main Usage
Communicates pet business growth stages, marketing achievements, and brand evolution through a circular flow structure that conveys continuous progress to audiences. Five distinct performance stages are presented clearly for immediate comprehension.
-
How to Use
Input specific achievement details (revenue growth, customer expansion, brand awareness, product diversification, market share) into each stage's text area. Present either stage-by-stage aligned with your narrative flow, or display the complete circular structure to show the holistic growth journey.
-
Recommended For
Ideal for pet store and pet product company executive reports, marketing team performance presentations, investor pitch meetings, and brand growth story sessions. Particularly suited for retail, distribution, and pet industry professionals delivering presentations.
-
Slide Structure
2-slide composition. First slide features a 5-stage circular diagram on orange background with central paw icon, five circular nodes, and stage labels. Second slide presents a brown background summary slide consolidating overall achievements. 16:9 widescreen format, fully editable PPTX.
Related Products
-

Visualizing Target Performance Figures – Emphasizing Key Achievements and Visual Appeal
#Company Introduction #Business Strategy #Diagram
-

Key Performance Diagram - Clarity for Business Strategy
#Company Introduction #Business Strategy #Diagram
-

Market Overview and Growth Trend – Strategic Data Analysis
#Business Strategy #Market and Competitor Analysis #Diagram
-

Diagram Slide Visualizing Key Award Winning Characteristics – Capturing Achievements
#Company Introduction #Diagram #Awards and Certifications, and Patents
