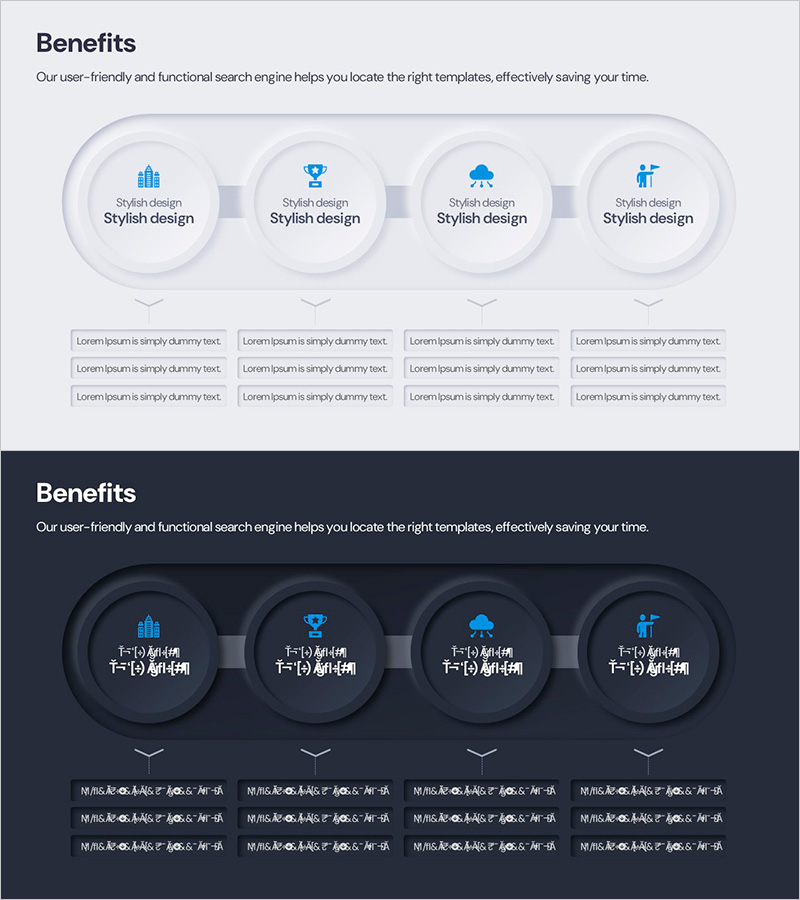
Cluster Diagram Visualizing Service Value Proposition
RM0800008_9
- Last Update 02/28/2025
- File Size 0.4MB
- # of Slides 2
- File Format PPTX
- Slide Ratio 16:9
- Color
Keywords
- #Content-Based Slides
- #Design-Based Slides
- #Product/Service Introduction
- #Business Strategy
- #Diagram
- #Benefits and Advantages
- #Achievements
- #Cluster
- #Inclusive Cluster Diagram
- #Chain Diagram
- #16:9
- #cluster diagram PowerPoint
- #value proposition slide
- #4-node diagram template
- #service value visualization
- #business diagram PowerPoint slide
About the Product
A cluster diagram PowerPoint slide with four nodes radiating from a central concept, ideal for visualizing service value propositions and business strategies. The design features white circular nodes with blue icons on a light gray background, with a dark theme version also included for flexible presentation environments. Each node represents an independent value element connected to the core concept, creating a clear information hierarchy. Perfect for product introductions, business strategy presentations, and value proposition explanations. Both light and dark theme versions are fully editable and ready to use immediately in your presentations.
Usage Points
-
Main Usage
Visualize core service or product values by radiating four key elements from a central concept. Effectively communicate multiple benefits or four strategic pillars to your audience at a glance. The clear information hierarchy makes complex concepts easy to understand and remember.
-
How to Use
Edit the text and icons in each node to match your content. Use the light theme for bright presentation venues and the dark theme for dimly lit environments. Customize node colors and icons to match your company's brand identity for a cohesive presentation.
-
Recommended For
Marketing professionals explaining product value, executives presenting business strategy pillars, consultants structuring customer solutions. Ideal for startup pitch decks, corporate strategy presentations, service launch events, and investor relations meetings.
-
Slide Structure
Two-slide set featuring one light theme and one dark theme layout. Each slide contains one central circular node with four surrounding nodes connected by relationship lines. Every node includes an icon and editable text area for flexible content customization.
Related Products
-

Visualizing Key Automotive Strategy – Cluster and Connection
#Product/Service Introduction #Operational Plan #Diagram
-

Airplane Composition Diagram – A New Benchmark for Data Analysis
#Product/Service Introduction #Diagram #Composition
-

Waterproof Interior Material Introduction – Diagram Highlighting Benefits and Features
#Product/Service Introduction #Diagram #Features
-

Curved Theme Purple Template Diagram
#Business Strategy #Marketing Plan and Strategy #Diagram
