Corporate Growth Timeline Visualized with Pictograms
RB0100035_4
- Last Update 03/04/2025
- File Size 2.1MB
- # of Slides 2
- File Format PPTX
- Slide Ratio 4:3
- Color
Keywords
About the Product
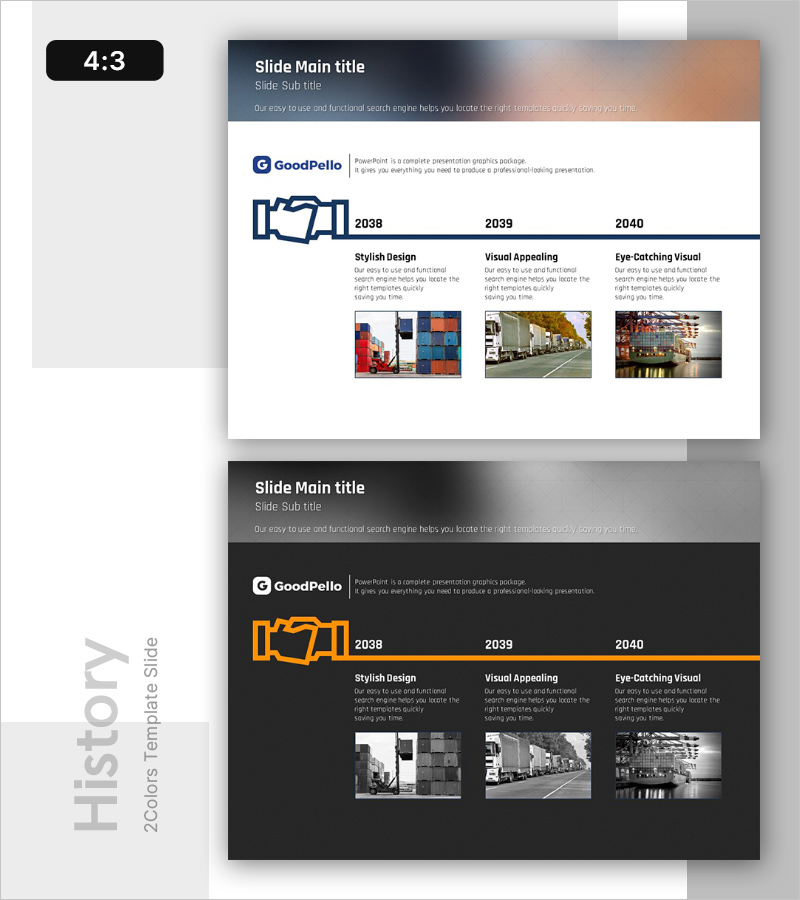
A PowerPoint slide that visualizes corporate growth across three time periods (2038, 2039, 2040) using a linear diagram structure. Each stage connects pictogram icons with descriptive text to clearly represent company milestones, key achievements, and strategic vision. The design features a navy background with orange accent elements that emphasize the directional flow of time. This presentation template is ready to use in company history sections, business reports, corporate overview slides, and investor pitch decks.
Usage Points
-
Main Usage
This diagram visually represents a company's past, present, and future growth stages in chronological order. Pictogram icons symbolize key milestones and achievements at each time period, enhancing audience comprehension and emphasizing the continuity and direction of corporate development.
-
How to Use
Insert this slide into company profile presentations, business report achievement sections, investor pitch decks, and corporate overview materials. Customize the text and icons to match your company's actual milestones, and adjust time periods or colors as needed to align with your brand identity.
-
Recommended For
Ideal for executives, marketing teams, and business development professionals preparing external presentations. Particularly effective for startup growth narratives, corporate rebranding announcements, mid-term strategy briefings, and employee onboarding materials that need to communicate company history.
-
Slide Structure
Two-slide set in 4:3 aspect ratio. The first slide features a navy gradient background with three horizontal nodes (2038, 2039, 2040), each connected to pictogram icons and descriptive text in a linear diagram format. The second slide provides the same structure with a dark background option for template flexibility.
Related Products
-

Visualizing Trends in Aerobic Training – Timeline Diagram
#Company Introduction #Diagram #History
-

Logistics Industry Growth History – Capturing the Journey of Success
#Company Introduction #Diagram #History
-

History of Eco-Friendly Energy Business – Visualization of Key Achievements
#Company Introduction #Diagram #History
-

History Folder Shape Diagram - Optimized for Company Introduction
#Company Introduction #Product/Service Introduction #Diagram
