Visualizing Market Overview with Doughnut Chart Slide - Global Insights Provided
RM0800008_10
- Last Update 02/28/2025
- File Size 0.9MB
- # of Slides 2
- File Format PPTX
- Slide Ratio 16:9
- Color
Keywords
- #Content-Based Slides
- #Design-Based Slides
- #Market and Competitor Analysis
- #Diagram
- #Graph
- #Market Status
- #Market Overview
- #Cluster
- #Circles
- #Closed Cluster Diagram
- #Doughnut Chart
- #16:9
- #doughnut chart PowerPoint
- #pie chart slide template
- #market analysis diagram
- #proportion data visualization
- #competitive analysis PPT
About the Product
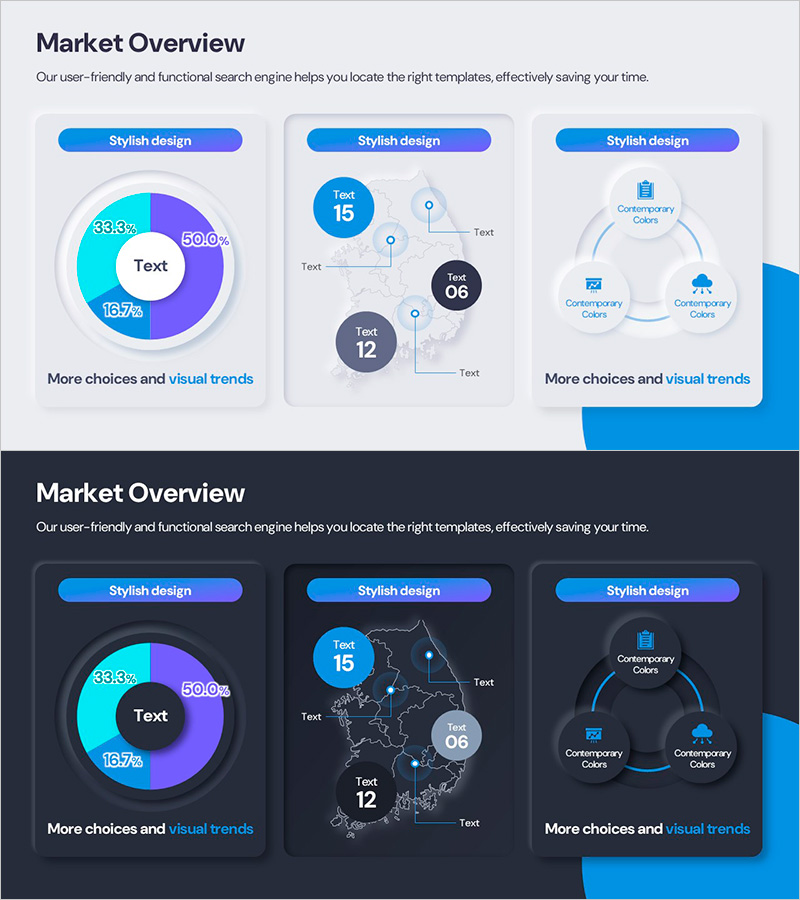
A doughnut chart PowerPoint slide designed to visualize market overview and competitive analysis. The 4-segment pie chart features a blue-to-purple gradient that intuitively represents market share, customer composition, sales ratios, and other proportion-based data. This 2-slide set includes a primary doughnut chart emphasizing key metrics on the first slide, and a network diagram with regional or categorical analysis on the second. Optimized for 16:9 widescreen format, it includes text labels and percentage displays for easy data interpretation. Ready to use immediately in presentations, business reports, and marketing plans.
Usage Points
-
Main Usage
Visualize proportion-based data such as market overview, customer composition, sales ratios, and market share using doughnut charts to enhance audience comprehension. Specialized for competitive analysis and global market insights, enabling stakeholders to grasp complex numerical data at a glance.
-
How to Use
Apply to market analysis sections in business reports, competitive environment analysis in marketing plans, and market size explanations in investor pitch decks. Edit text and percentages in each segment to input actual data. Color customization is straightforward, allowing alignment with brand guidelines.
-
Recommended For
Marketing managers, business planning teams, financial analysts, consultants, and executives presenting market conditions and competitive landscapes. Particularly valuable for B2B presentations, shareholder meetings, and strategic planning sessions requiring credible data representation.
-
Slide Structure
Slide 1: 4-segment doughnut chart (33.8%, 50.0%, 13.7% with percentage labels) + center text area. Slide 2: Regional network diagram (Text 15, Text 06, Text 12 nodes) + connecting lines + text input fields. Total 2 slides, 16:9 aspect ratio, PPTX format.
Related Products
-

Leaves Donut Chart – Fresh Approach to Data Visualization
#Product/Service Introduction #Market and Competitor Analysis #Diagram
-

Market Status Chart for Point Frame
#Market and Competitor Analysis #Financial Plans and Performance #Diagram
-

SUV Percentage Donut Graph – Market Status Analysis
#Market and Competitor Analysis #Diagram #Graph
-

Market Share Analysis Graph by Technology – Competition and Collaboration
#Market and Competitor Analysis #Diagram #Graph
