Market Status Chart for Point Frame
RJ0900030_20
- Last Update 08/25/2025
- File Size 0.4MB
- # of Slides 2
- File Format PPTX
- Slide Ratio 16:9
- Color
Keywords
- #Content-Based Slides
- #Design-Based Slides
- #Market and Competitor Analysis
- #Financial Plans and Performance
- #Diagram
- #Graph
- #Market Status
- #Projected Return on Investment (ROI)
- #Cluster
- #Circles
- #Closed Cluster Diagram
- #Doughnut Chart
- #16:9
- #donut chart PowerPoint
- #pie chart slide template
- #ratio visualization graph
- #market analysis PPT
- #financial presentation slide
About the Product
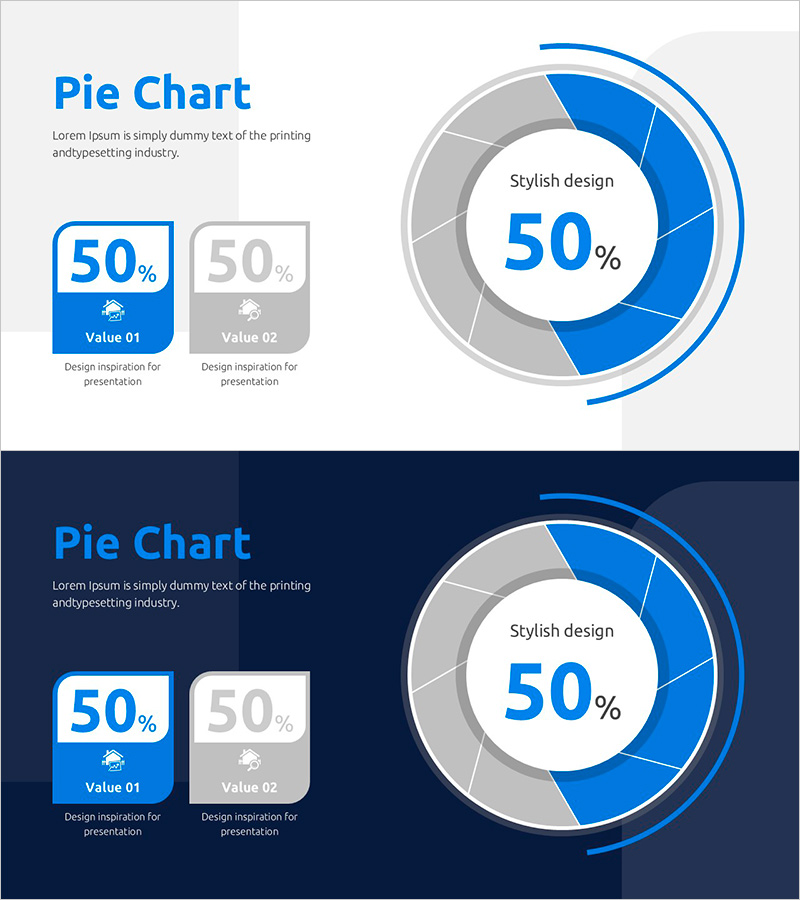
A professional donut pie chart PowerPoint slide designed for market status analysis and financial planning presentations. This slide deck includes two versions with light and dark backgrounds, allowing flexible integration into any presentation theme. The center circular area highlights key metrics (50%), while the left side features two value boxes for direct data comparison. The blue and gray color scheme conveys professionalism and clarity, making it ideal for financial reports, market analysis sections, and revenue breakdown presentations. The 16:9 widescreen format ensures compatibility with modern projectors and online presentations.
Usage Points
-
Main Usage
Effectively visualize two-item ratio comparisons such as market share, revenue composition, customer distribution, and asset allocation. The centered metric (50%) draws audience focus while the left-side value boxes provide clear context for each segment. Perfect for financial reports, quarterly reviews, and strategic presentations.
-
How to Use
Select either the light or dark background version based on your presentation theme. Replace the 50% metric and Value 01/Value 02 labels with your actual data. Adjust the blue and gray donut segments proportionally to match your data ratios. The 16:9 format is pre-optimized for widescreen displays and online sharing platforms.
-
Recommended For
Finance teams, marketing departments, and executive leadership preparing quarterly reports, investor pitches, and strategic plans. Ideal for presentations requiring clear two-category ratio visualization such as profit margins, market segments, customer demographics, or budget allocation. Enhances data credibility in business plans and investor relations materials.
-
Slide Structure
2-slide set: light background version + dark background version. Each slide features a two-column layout with title/description area on the left and donut pie chart on the right. The donut chart displays a centered white circle with 50% metric, surrounded by blue and gray segments (approximately 50% each). Two value text boxes positioned below the chart title on the left side.
Related Products
-

Visualizing Market Overview with Doughnut Chart Slide - Global Insights Provided
#Market and Competitor Analysis #Diagram #Graph
-

Market Share Analysis Graph by Technology – Competition and Collaboration
#Market and Competitor Analysis #Diagram #Graph
-

Camping Business Step-by-Step Future Plan Donut Chart
#Market and Competitor Analysis #Financial Plans and Performance #Graph
-

Graph of User Status Analysis by Age Group
#Market and Competitor Analysis #Diagram #Graph
