SUV Percentage Donut Graph – Market Status Analysis
RJ0800052_12
- Last Update 08/15/2025
- File Size 1MB
- # of Slides 2
- File Format PPTX
- Slide Ratio 16:9
- Color
Keywords
- #Content-Based Slides
- #Design-Based Slides
- #Market and Competitor Analysis
- #Diagram
- #Graph
- #Market Status
- #Competitive Advantage
- #Cluster
- #Circles
- #Closed Cluster Diagram
- #Doughnut Chart
- #16:9
- #donut chart PowerPoint slide
- #pie chart template
- #market share analysis
- #5-segment data visualization
- #circular chart presentation download
About the Product
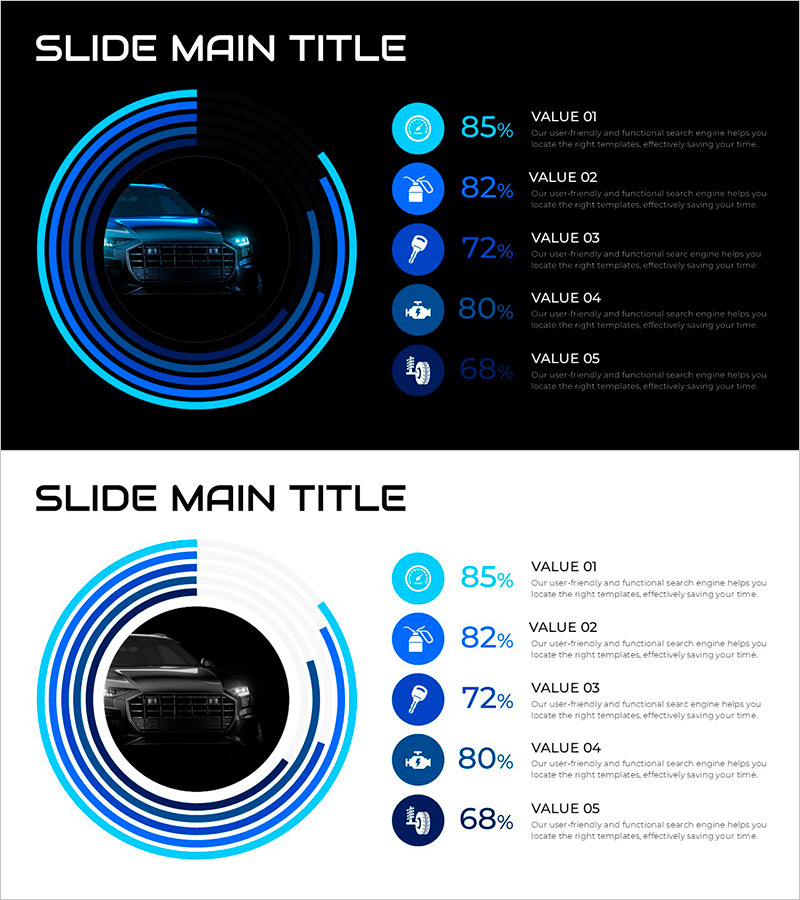
A professional donut chart PowerPoint slide designed for market analysis and competitive positioning presentations. The template features a multi-layered circular donut structure in bright cyan tones, with a central image area for product photos or key visual assets, and a right-aligned icon-based metrics list displaying percentages and descriptions for five data segments. This slide deck is ready to use in business reports, market analysis presentations, and competitive intelligence briefings. The 16:9 widescreen format includes two layout variations to accommodate different data scenarios and presentation contexts.
Usage Points
-
Main Usage
Visualize the proportional relationships of five data categories such as market share, product performance metrics, or competitive positioning. The central image area emphasizes key products or brand logos, while the right-side icon-based metrics list provides specific percentages and supporting descriptions for each segment.
-
How to Use
Input percentage values into each donut segment corresponding to your data categories. Update the VALUE 01-05 labels with item names, percentages, and descriptive text on the right side. Insert product images, market maps, or competitor logos in the central area to customize the slide for your specific presentation context.
-
Recommended For
Marketing managers, sales strategy teams, business executives preparing reports, market research analysts, and product planning teams presenting market conditions, customer satisfaction scores, sales channel distribution, competitive advantages, and market positioning data.
-
Slide Structure
Two-slide layout with dark background (black) on slide one and light background (white) on slide two, both featuring identical donut chart structure. Each slide displays a five-layer concentric donut chart on the left-center, with five icon-based metric items (85%, 82%, 72%, 80%, 68%) vertically aligned on the right side.
Related Products
-

Natural Recreation Area Preference Chart – Market Status Analysis
#Market and Competitor Analysis #Diagram #Graph
-

Doughnut Chart Slide for Market and Competitive Analysis – Sports Trends & Strategic Issues
#Market and Competitor Analysis #Diagram #Graph
-

Visualizing Market Overview with Doughnut Chart Slide - Global Insights Provided
#Market and Competitor Analysis #Diagram #Graph
-

Dental Caries Treatment Analysis Donut Circle Graph – A Clear Competitive Edge
#Market and Competitor Analysis #Diagram #Graph
