Market Overview and Growth Trend – Strategic Data Analysis
RM0800004_9
- Last Update 02/28/2025
- File Size 1.1MB
- # of Slides 2
- File Format PPTX
- Slide Ratio 16:9
- Color
Keywords
- #Content-Based Slides
- #Design-Based Slides
- #Business Strategy
- #Market and Competitor Analysis
- #Diagram
- #Graph
- #Achievements
- #Industry Trends
- #Cluster
- #Line
- #Chain Diagram
- #Line Chart
- #16:9
- #line chart PowerPoint slide
- #market analysis presentation template
- #growth trend visualization
- #business data chart
- #multi-series line graph template
About the Product
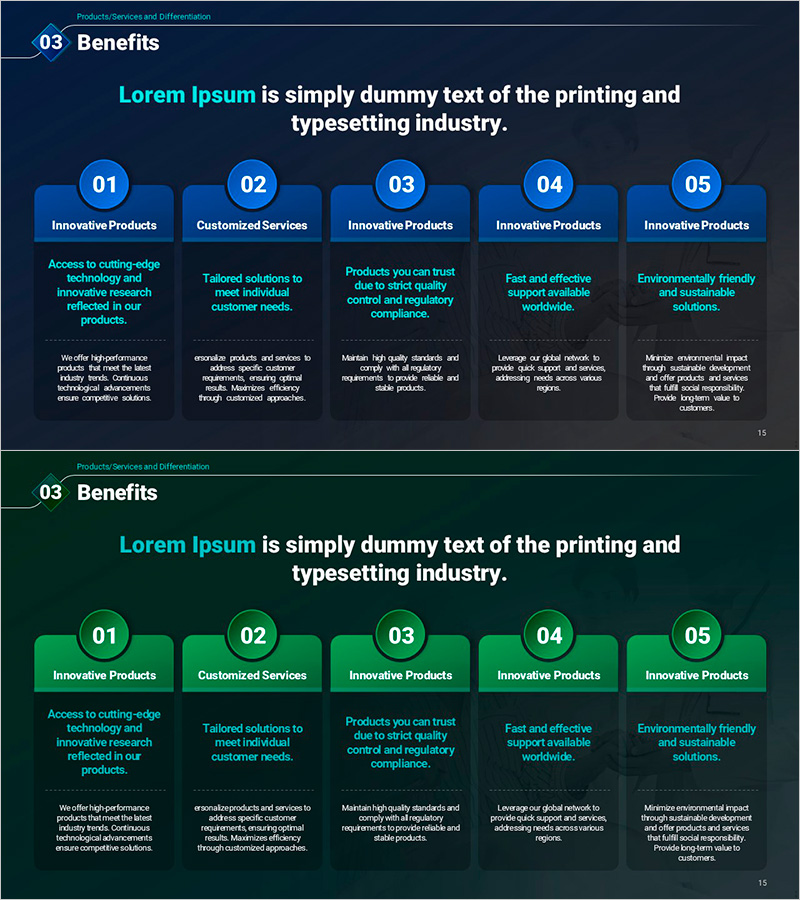
A 5-series line chart PowerPoint slide that visualizes market overview and growth trends over time. Set against a dark navy background with cyan accent lines, this slide clearly displays data fluctuations and comparative growth rates across multiple market segments. The 2-slide deck is ready to use in strategic planning presentations, competitive analysis, and market forecasting. Compatible with all presentation environments in 16:9 widescreen PPTX format, enabling immediate integration into business plans, investor pitches, and market reports.
Usage Points
-
Main Usage
Visualize market overview and growth trends across time periods and market segments using multi-series line charts. This slide enables simultaneous comparison of different market trajectories and growth rates, providing quantitative evidence for strategic decision-making and competitive positioning.
-
How to Use
Insert into business plans, investor pitch decks, and market analysis reports within the market overview section. Each line represents a distinct market segment, product category, or geographic region. Directly input your data to instantly transform the template with real figures and custom labels.
-
Recommended For
Marketing managers, strategic planning teams, executives preparing board reports, investor relations professionals, and market analysts benefit most from this template. Ideal for presenting quarterly or annual growth comparisons, competitive benchmarking, market share evolution, and multi-segment performance tracking.
-
Slide Structure
2-slide package featuring a 5-series line chart with Y-axis values and X-axis time periods on the first slide, with an alternate color variant on the second. Each line is independently editable, and legend, axis labels, and data points can be freely customized to match your specific data and branding.
Related Products
-

Annual Momentum Record – Visualization of Achievements
#Business Strategy #Market and Competitor Analysis #Graph
-

System Efficiency Growth – Market Analysis and Business Strategy
#Business Strategy #Market and Competitor Analysis #Graph
-

Curve Graph of a Meal – Business Strategy
#Business Strategy #Market and Competitor Analysis #Graph
-

Infographic Slide Visualizing App Market Sales Trends
#Business Strategy #Market and Competitor Analysis #Graph
