Financial Performance and Forecast – Diagram for Business Strategy
RM0800004_6
- Last Update 02/28/2025
- File Size 0.8MB
- # of Slides 2
- File Format PPTX
- Slide Ratio 16:9
- Color
Keywords
- #Content-Based Slides
- #Design-Based Slides
- #Business Strategy
- #Financial Plans and Performance
- #Diagram
- #Graph
- #Other
- #Achievements
- #Projected Return on Investment (ROI)
- #Table
- #Standard Table
- #16:9
- #4-step goals diagram PowerPoint
- #business process slide template
- #strategy roadmap presentation
- #step-by-step process diagram
- #business goal visualization slide
About the Product
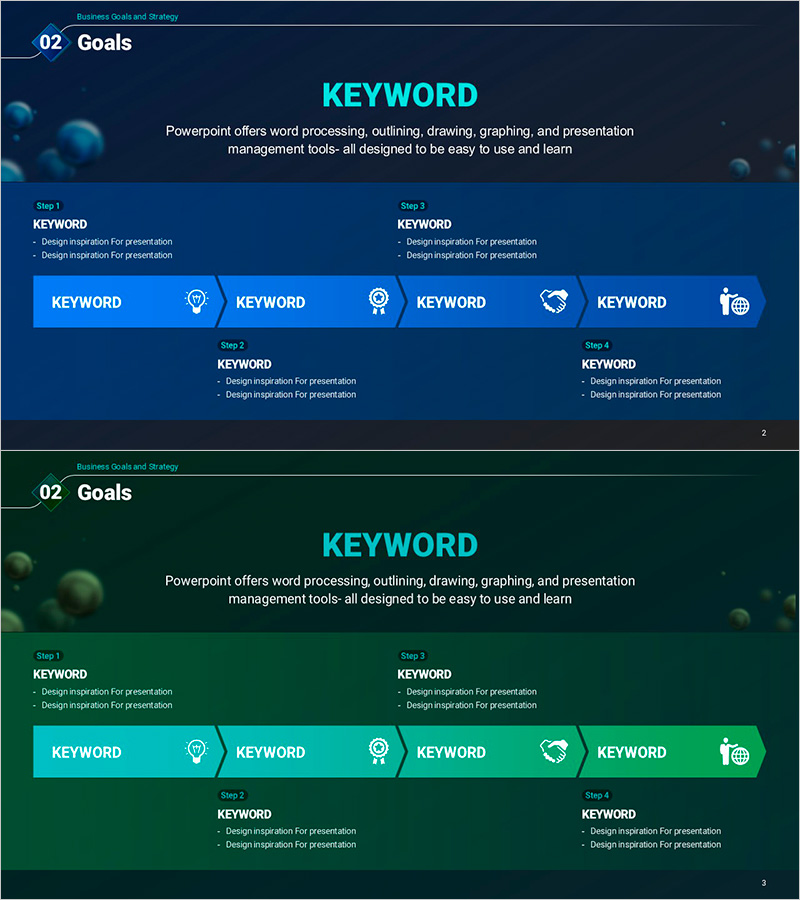
A PowerPoint slide that visualizes a 4-step business goal achievement process with clear visual hierarchy. Featuring a dark blue background with cyan accent boxes and strategic icons, this slide template enables you to present each phase of your business strategy effectively. Ideal for financial performance analysis, business strategy presentations, and investment planning decks. The 2-slide set includes color variations in dark blue and dark green, optimized for 16:9 widescreen format to fit modern presentation environments.
Usage Points
-
Main Usage
Designed to visually communicate multi-phase business strategies and goal achievement roadmaps. Perfect for executive presentations, financial performance reports, investment pitches, and strategic planning sessions where you need to break down complex business objectives into clear, sequential steps.
-
How to Use
Enter goal titles, descriptions, and responsible parties in each step box. Icons can be customized to reflect each phase's characteristics, and colors and text can be adapted to match your organization's branding. Use in board meetings, investor presentations, and team strategy workshops.
-
Recommended For
CFOs, financial planners, business development managers, executives, consultants, and startup founders presenting business strategies, financial forecasts, investment proposals, and operational roadmaps.
-
Slide Structure
2-slide set with dark blue and dark green background variations. Each slide features a title area at the top and 4 horizontally arranged step boxes. Each box contains an icon, title field, and description text area. Optimized for 16:9 widescreen format for contemporary presentation environments.
Related Products
-

Onion Ingredients and Analysis Charts - Data Visualization in Food Industry
#Product/Service Introduction #Business Strategy #Diagram
-

Progress Donut Chart for Each Library Service
#Business Strategy #Market and Competitor Analysis #Graph
-

Donut Chart and Mobile Mockup – Market Share Analysis
#Business Strategy #Market and Competitor Analysis #Graph
-

Current Accomplished Numerical Graph – Diagram Visualizing Achievements
#Business Strategy #Marketing Plan and Strategy #Diagram
