Status Analysis Donut Link Chart – Market and Competitor Analysis
RM0300013_7
- Last Update 02/10/2025
- File Size 1.7MB
- # of Slides 2
- File Format PPTX
- Slide Ratio 16:9
- Color
Keywords
- #Content-Based Slides
- #Design-Based Slides
- #Company Introduction
- #Market and Competitor Analysis
- #Diagram
- #Graph
- #Other
- #Shareholder Structure
- #Market Analysis
- #Table
- #Standard Table
- #16:9
- #donut chart PowerPoint
- #pie chart slide template
- #market analysis diagram
- #competitor analysis PowerPoint
- #data visualization slide
- #how to create pie chart in PowerPoint
About the Product
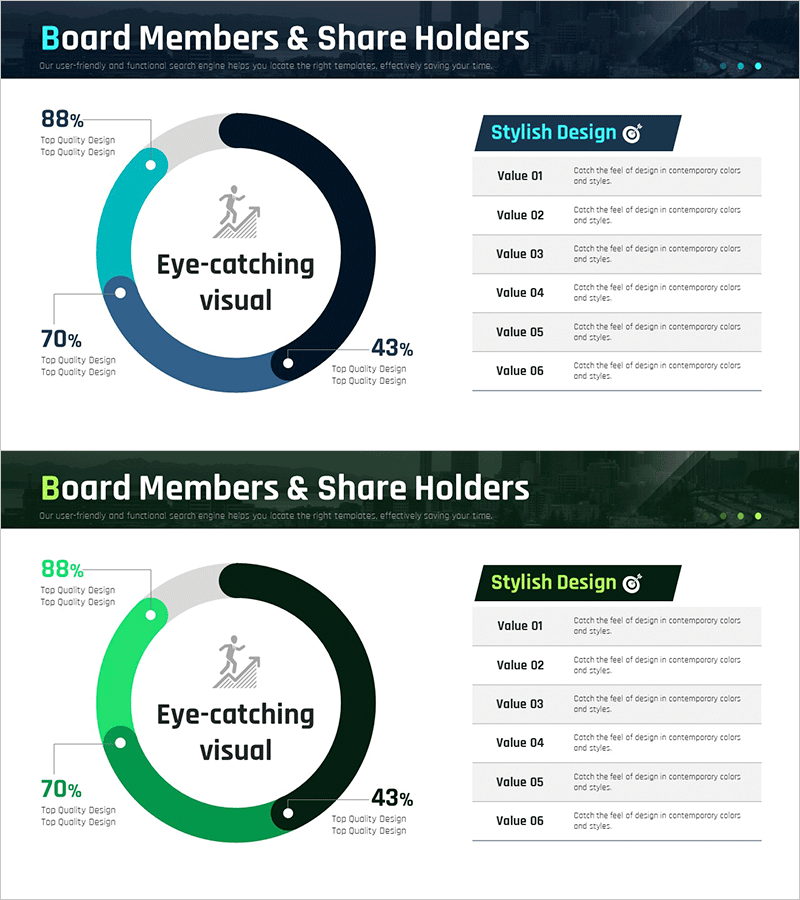
A PowerPoint slide featuring a donut link chart designed for market status and competitor analysis presentations. The three-segment pie chart uses a central icon and connecting lines to visualize key metrics with cyan, navy, and black gradient fills representing data hierarchy. Each segment displays percentage values and labels for intuitive comparative analysis. This 2-slide, 16:9 ratio PPTX file is fully editable and suitable for business reports, investor pitch decks, and executive presentations.
Usage Points
-
Main Usage
Visualize 3-4 ratio data points such as market share, competitor positioning, or shareholder composition using a donut chart. The central icon and connecting lines emphasize segment relationships, while percentage values provide quantitative evidence for data-driven analysis.
-
How to Use
Insert into business reports' market analysis sections, investor pitch decks' competitive landscape slides, or executive dashboards. Edit segment colors and values to reflect actual data, customize label text, and adjust the information box content as needed for your presentation context.
-
Recommended For
Marketing managers, strategy planners, financial analysts, and business development professionals presenting market share, competitive positioning, or organizational structure. Ideal for presentations requiring objective, data-backed analysis with clear visual hierarchy.
-
Slide Structure
Three-segment donut chart with gradient fills (displaying 88%, 70%, 43% values), central icon with upward arrow symbol, and right-aligned information box with 6 content areas. Connecting lines and nodes link segments to emphasize data relationships and comparative context.
Related Products
-

Detailed Analysis of Shareholder Status Donut Chart
#Company Introduction #Market and Competitor Analysis #Diagram
-

Shareholder Status Survey Donut Graph – Optimized for Market Analysis
#Company Introduction #Market and Competitor Analysis #Diagram
-

Shareholder Status Analysis Donut Pie Chart – Corporate Growth and Competitive Analysis
#Company Introduction #Market and Competitor Analysis #Diagram
-

Shareholder Status Analysis Donut Chart – Insights and Analysis
#Company Introduction #Market and Competitor Analysis #Diagram
