Curved Graphics Business Report PowerPoint Template – Modern Design and Elegant Colors
M0800003
- Last Update 07/25/2025
- File Size 5MB
- # of Slides 21
- File Format PPTX
- Slide Ratio 16:9
- Color
Slide Preview


Keywords
About the Product
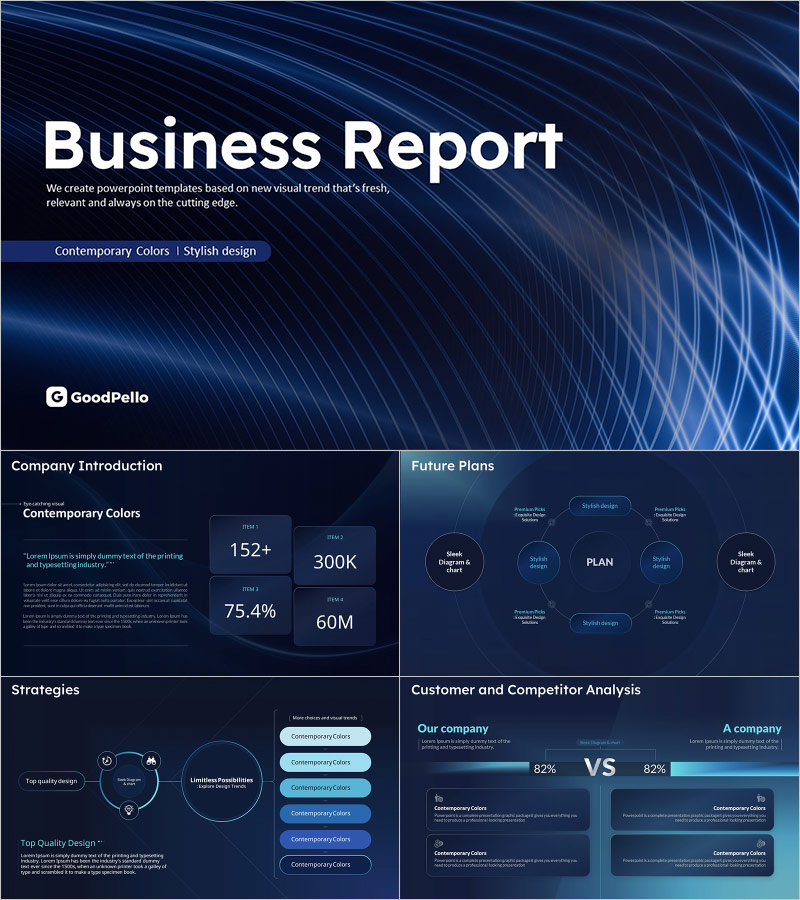
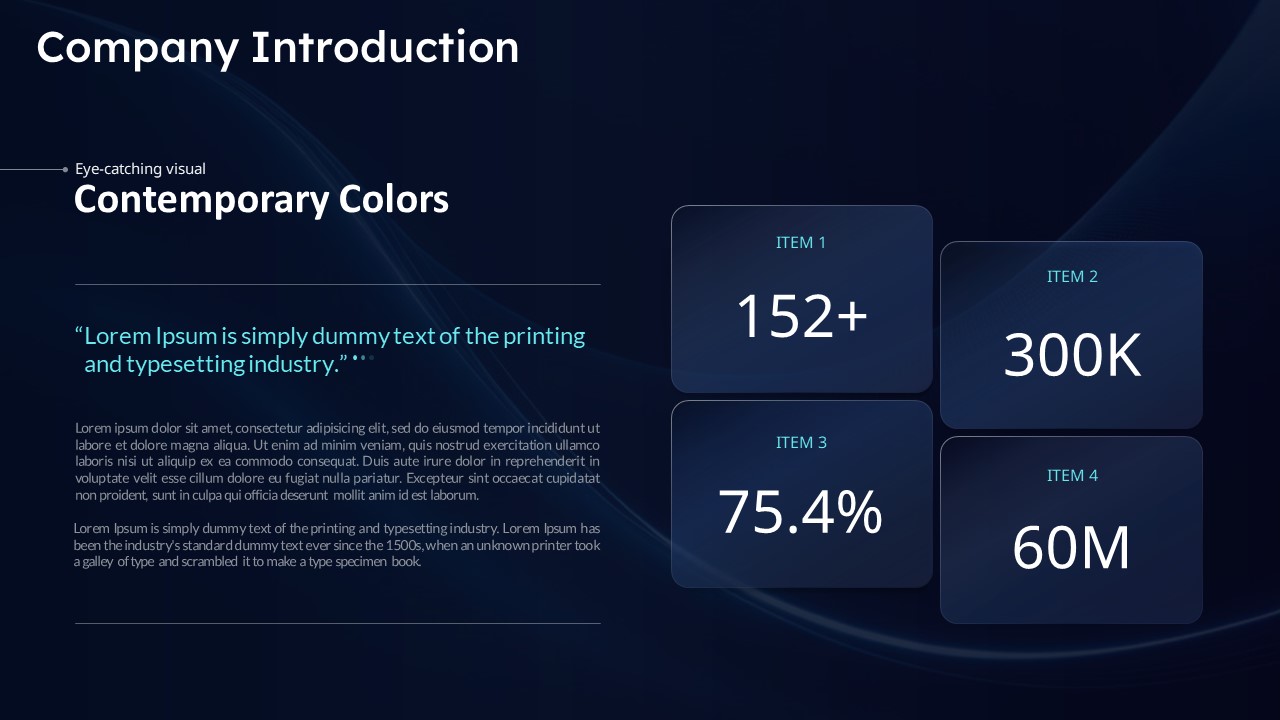
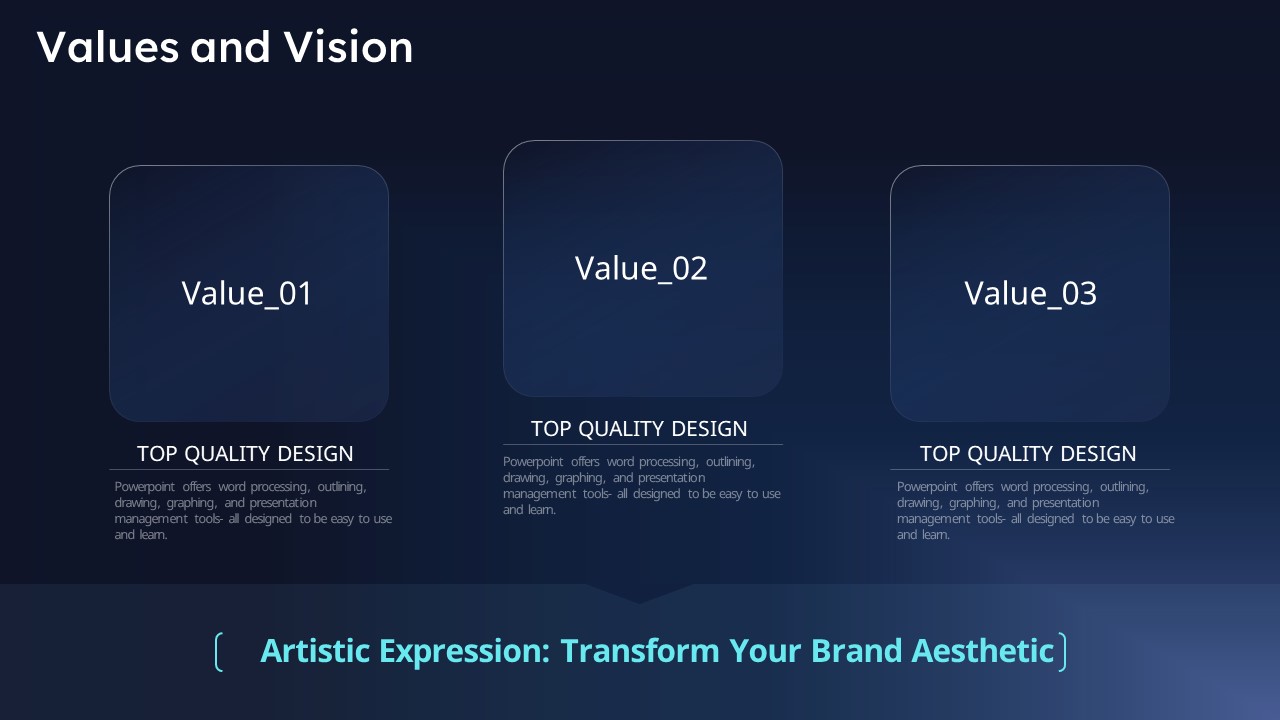
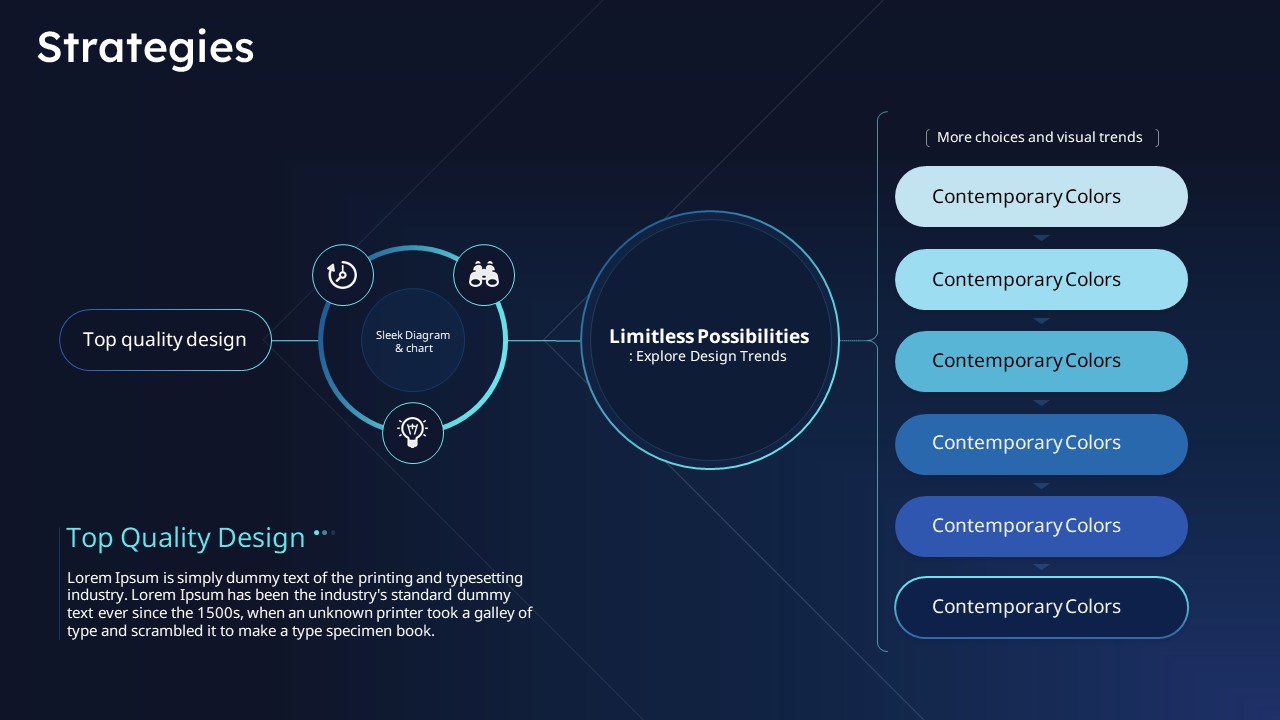
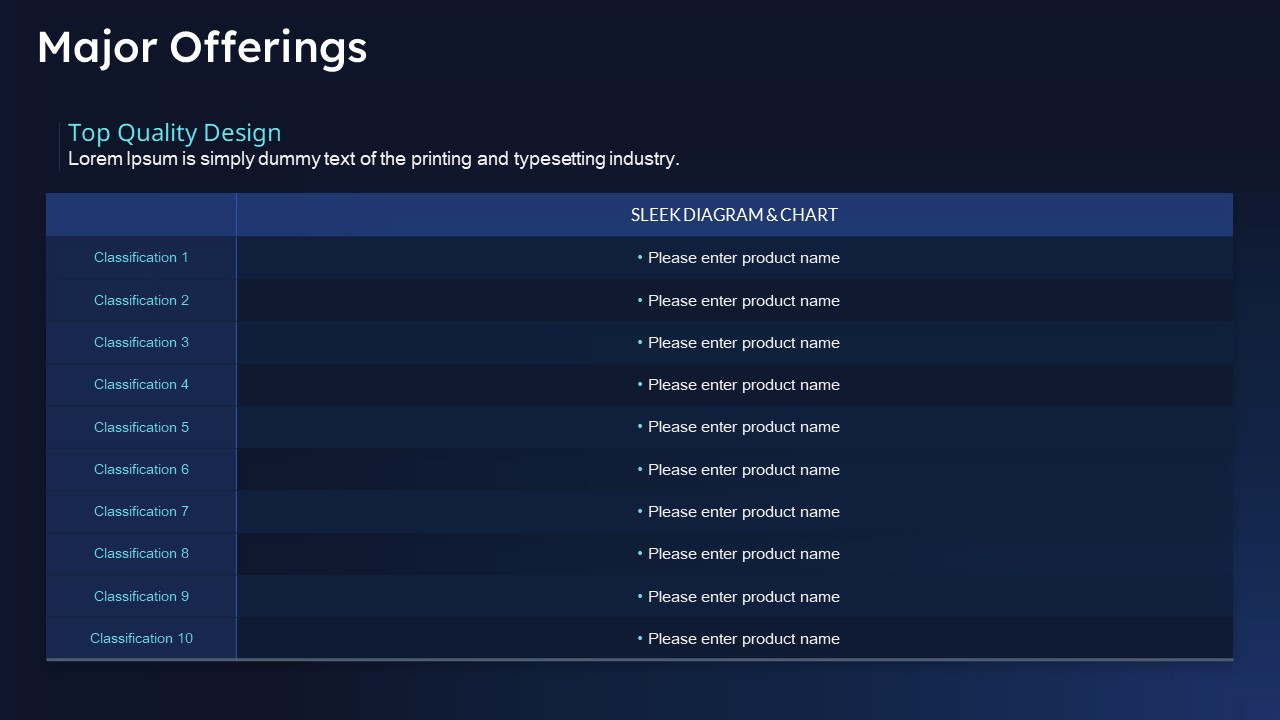
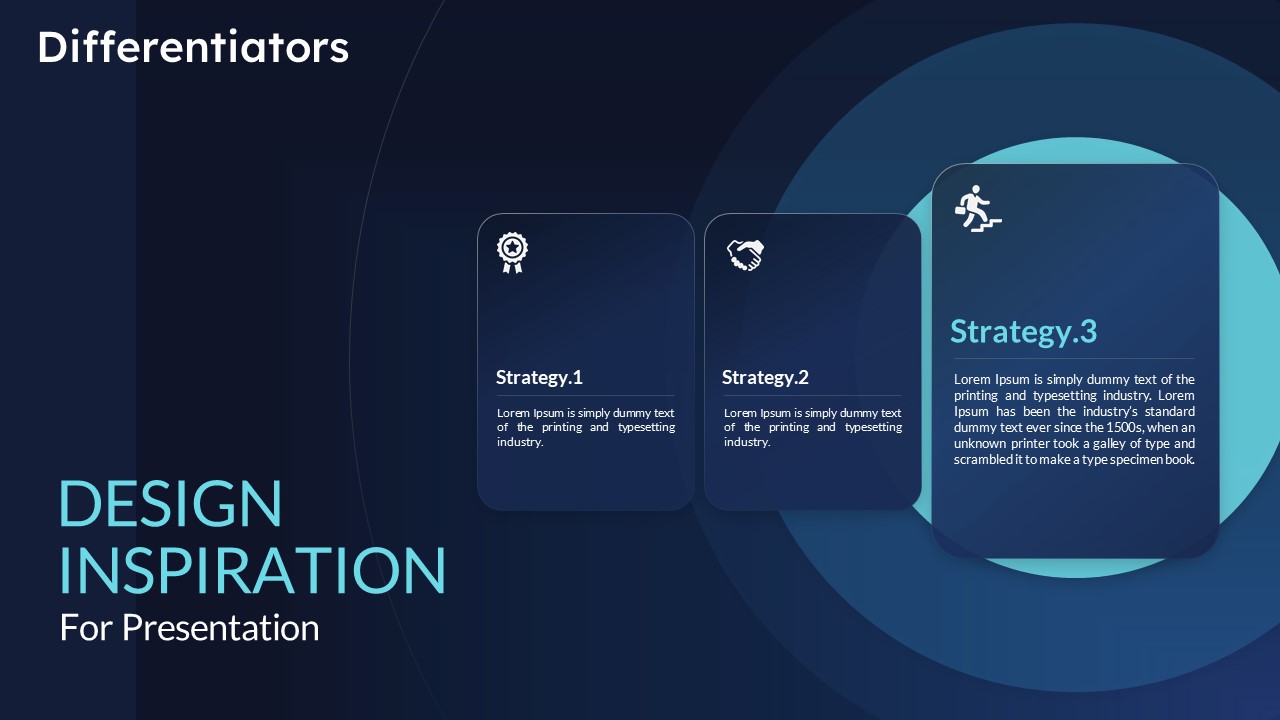
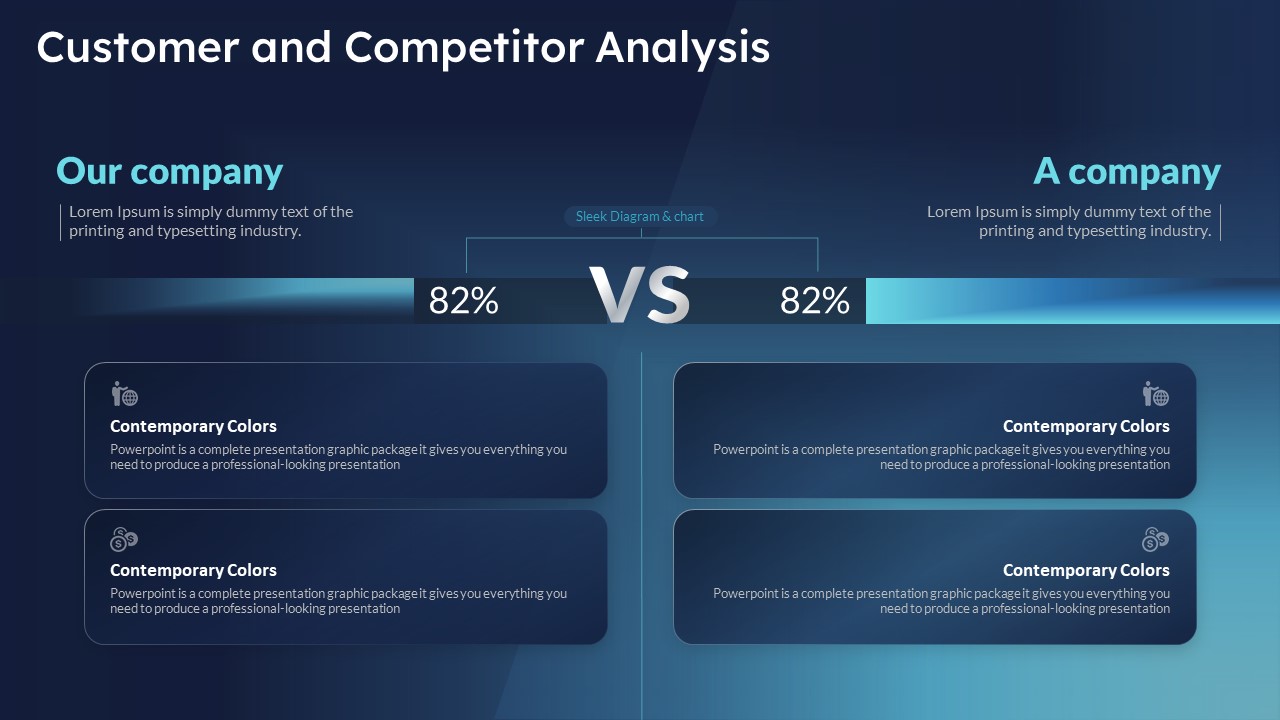
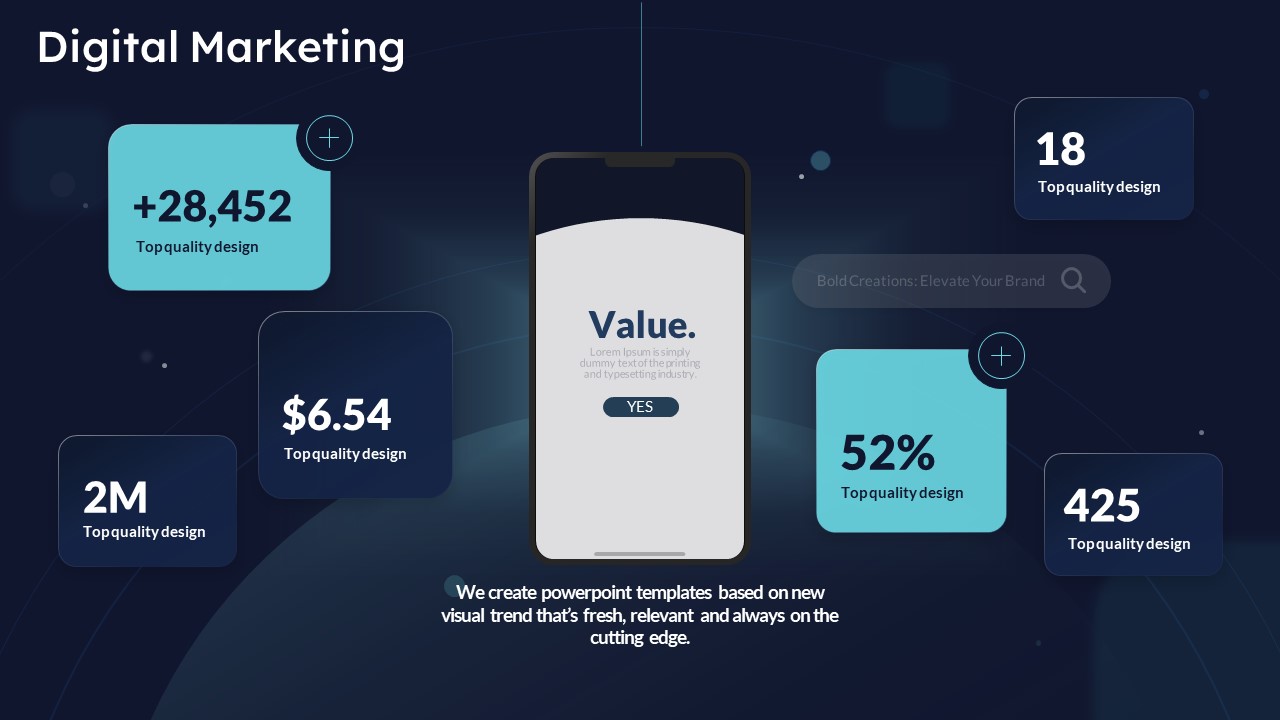
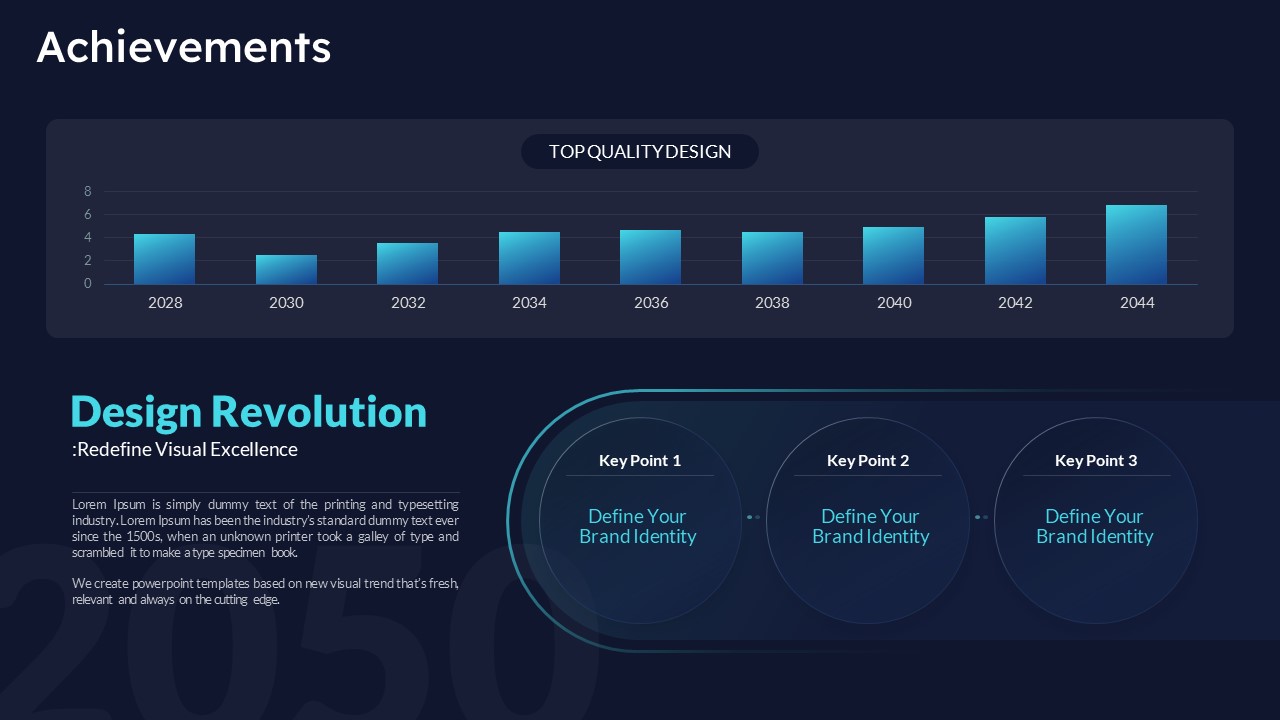
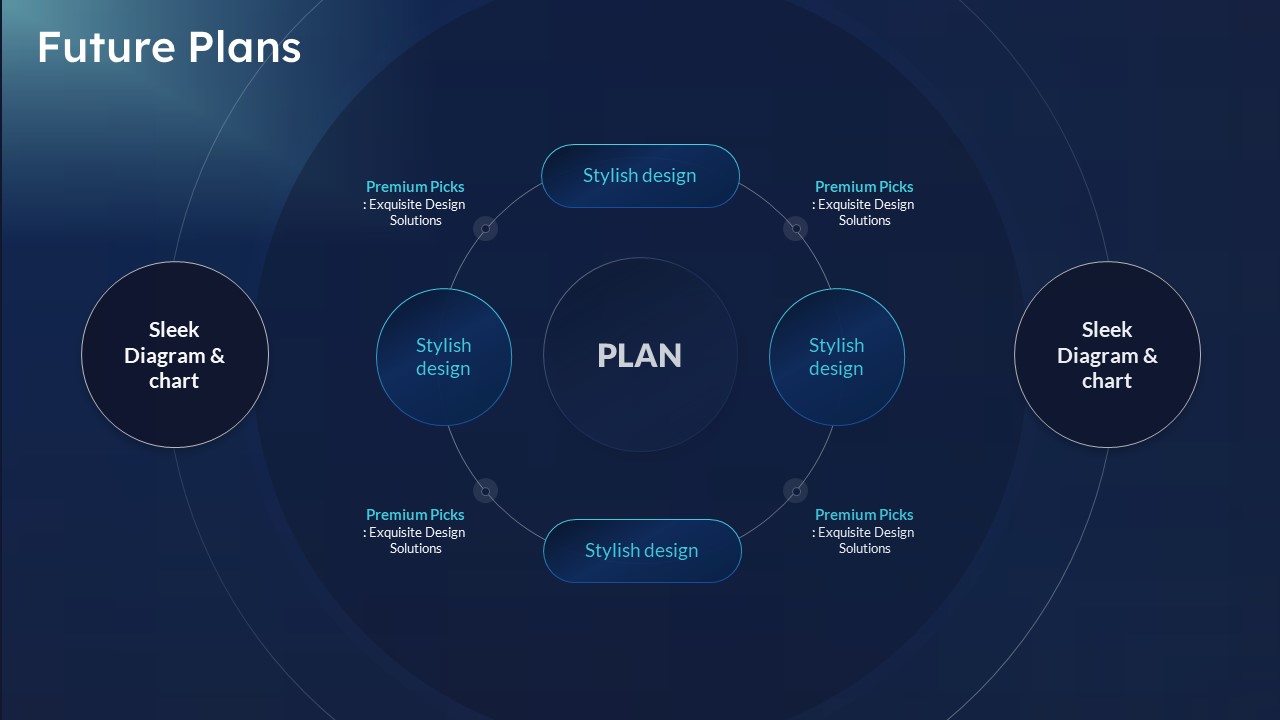
This business report PowerPoint template features a deep navy dark background with cyan accents and curved light-ray graphics, designed for professional performance reporting and executive presentations. The 21-slide deck includes a bold cover slide, KPI metric cards (displaying figures such as 152+, 300K, 75.4%, and 60M), a radial future plans diagram, a circular strategy diagram with item lists, a customer and competitor VS comparison table, a 10-row major offerings classification table, and a three-column differentiators card layout. Each slide is fully editable in PowerPoint — simply replace the placeholder text and figures with your own data to produce a polished presentation. The dark-tone design with cyan typographic hierarchy delivers strong visual focus during data-driven business briefings, annual reviews, and investor updates. This slide deck is ready to use immediately after download.
Usage Points
-
Main Usage
Designed for executive briefings, investor updates, and annual or quarterly performance reviews where data-driven storytelling and professional visual impact are essential for communicating business results.
-
How to Use
Open the PPTX file in PowerPoint, replace placeholder text and figures in the KPI cards and tables with your actual data, and update diagram labels to reflect your company's strategy and competitive landscape. Color themes can be adjusted as needed.
-
Recommended For
Strategy and planning teams preparing board or investor presentations, IR managers converting annual reports into slide decks, and marketing teams visualizing competitive analysis results will find this template immediately useful.
-
Slide Structure
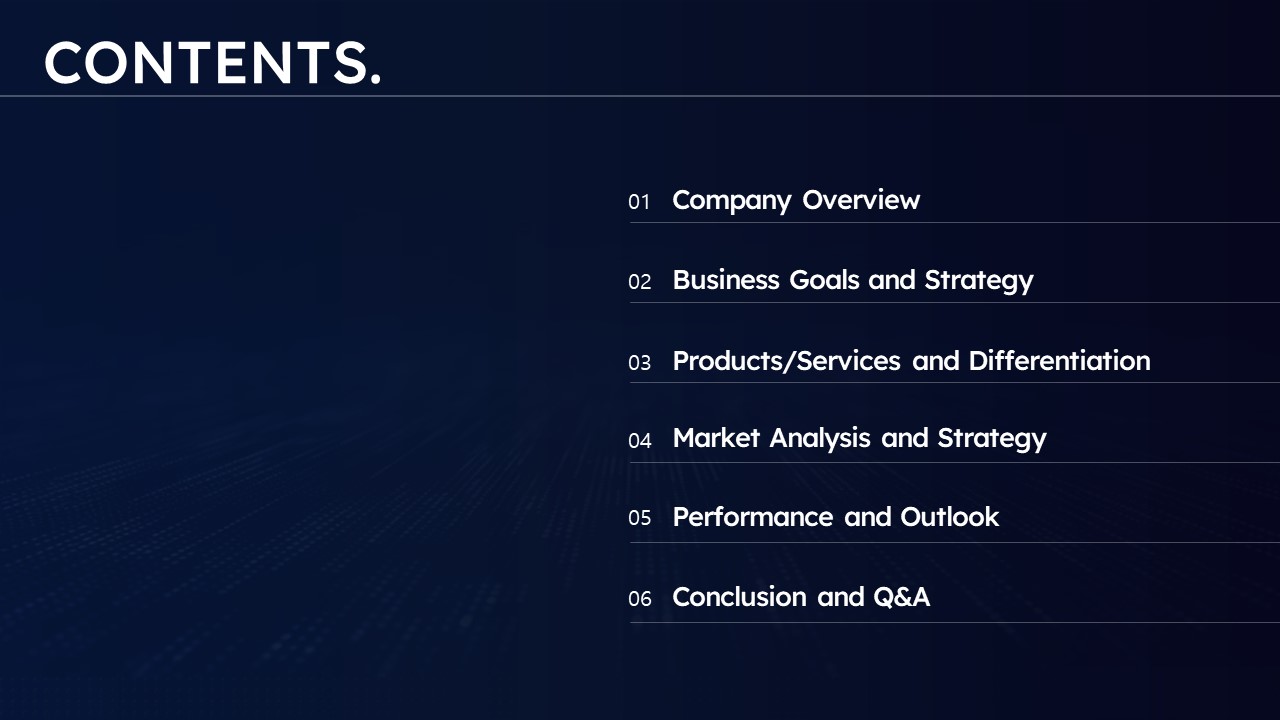
Cover (Business Report) → Company intro with KPI metric cards (152+, 300K, 75.4%, 60M) → Future Plans radial diagram → Strategies circular diagram with item list → Customer & Competitor Analysis VS comparison table → Major Offerings 10-row classification table → Differentiators 3-column strategy cards — 21 slides total
Related Products
-

Pet Goods Store Business Report PowerPoint Template - Vibrant Design
#Business/Performance Report
-

Neumorphism Business Report PowerPoint Template – Stylish Design and Practical Layout
#Business/Performance Report
-

Environmental Business Report Template – Modern and Stylish Design
#Business/Performance Report
-

Financial Industry Trend & Strategy Report Template – Clean and Modern Design
#Business/Performance Report
