Business System Architecture Diagram – Perfect Visualization for Technical Sections
RM0800002_8
- Last Update 10/03/2025
- File Size 11.3MB
- # of Slides 2
- File Format PPTX
- Slide Ratio 16:9
- Color
Keywords
- #Content-Based Slides
- #Design-Based Slides
- #Operational Plan
- #Technical Approach
- #Diagram
- #Production and Technology Development Strategy
- #System Architecture Diagram
- #Flow
- #Linear Flow
- #16:9
- #linear diagram PowerPoint
- #system architecture diagram slide
- #3-step flowchart template
- #technical architecture visualization
- #how to create system diagram in PowerPoint
About the Product
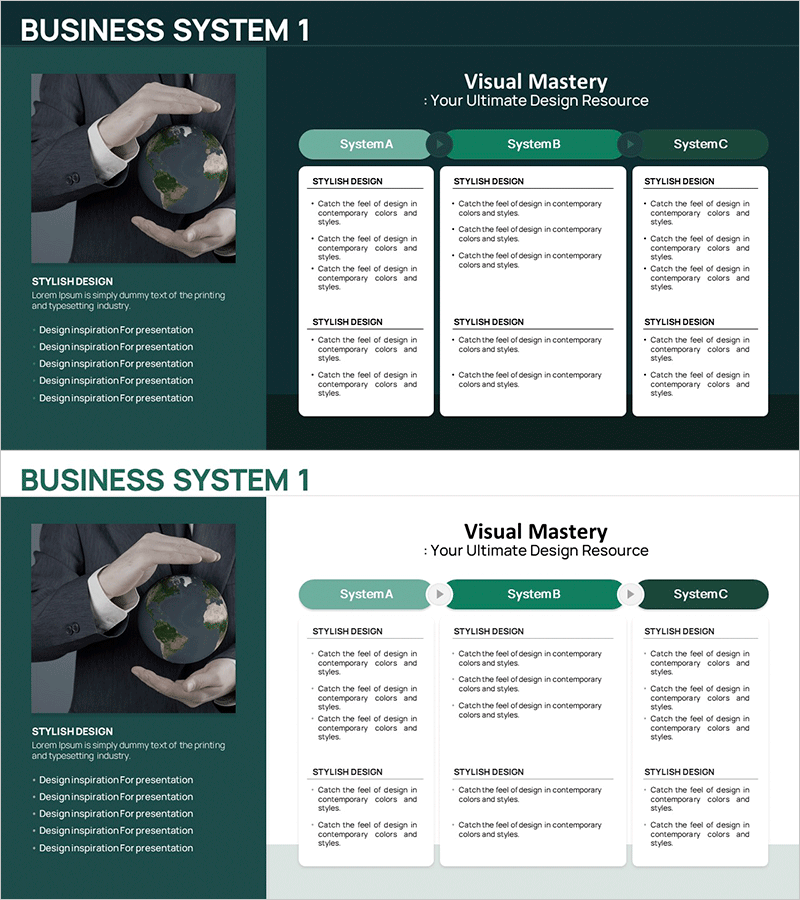
A PowerPoint slide that visualizes business system hierarchy through a 3-step linear diagram. The dark green background with mint and forest green accent boxes and arrows clearly illustrates technical architecture. The layout combines a left image area with right-side text boxes for intuitive process flow communication. This 2-slide set is ready to use for system structure explanations and technical presentations.
Usage Points
-
Main Usage
Designed to visually explain hierarchical system structures and step-by-step process flows. Effectively communicates technical architecture, operational system composition, and business process stages.
-
How to Use
Insert relevant photos or icons in the left image area and add step-by-step descriptions in the right text boxes. Guide audience attention naturally through the 3-step arrow flow during presentation.
-
Recommended For
Ideal for technical team reports, system architecture explanations, operational plan presentations, product technology introductions, and IT department presentations. Suitable for engineers, technical managers, and system administrators.
-
Slide Structure
2-slide set. Each slide divided into left image area (approximately 40%) and right 3-step linear diagram area (approximately 60%). Dark green background with mint and forest green 3-box steps connected by rightward arrows for sequential flow.
Related Products
-

Vertical Learning Roadmap Slide – Clear Flow and Progression
#Business Management #Operational Plan #Diagram
-

The Journey from Harvest to Production – Flow and Strategy
#Operational Plan #Marketing Plan and Strategy #Diagram
-

Genetic Prototype Infographic – Optimized for Operations and Technology Development
#Operational Plan #Technical Approach #Diagram
-

Online Presentation Template Diagram8
#Operational Plan #Technical Approach #Diagram
