Diagram of Agricultural Process – Operational Planning through Cyclic Flow
RJ0600096_15
- Last Update 07/16/2025
- File Size 0.1MB
- # of Slides 2
- File Format PPTX
- Slide Ratio 16:9
- Color
Keywords
- #Content-Based Slides
- #Design-Based Slides
- #Business Strategy
- #Operational Plan
- #Diagram
- #Production Plan
- #Production and Technology Development Strategy
- #Flow
- #Cluster
- #Linear Flow
- #Closed Cluster Diagram
- #16:9
- #circular diagram PowerPoint
- #3-stage cycle diagram
- #agricultural operational planning slide
- #process flow PowerPoint template
- #cyclic process diagram slide
About the Product
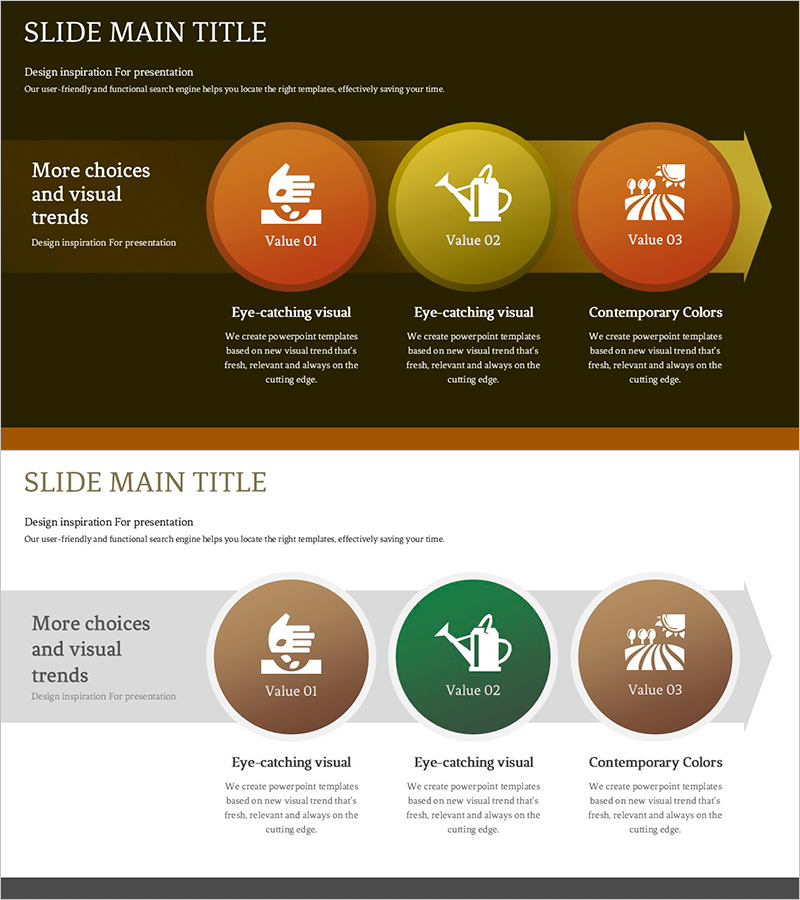
A 3-stage circular diagram PowerPoint slide designed to visualize agricultural operational planning and cyclic processes. Three gradient-filled circular nodes in orange and yellow tones are arranged in clockwise sequence, clearly representing continuous workflow and interdependencies. Each node includes an icon placeholder and text field, with descriptive text areas positioned below. The 2-slide set features two background color variations (dark brown and light gray) for flexible presentation contexts. Formatted in 16:9 widescreen ratio for modern presentation environments. Ideal for agricultural operations, manufacturing processes, business cycle explanations, and sustainability initiatives requiring visual process flow representation.
Usage Points
-
Main Usage
Clearly visualizes 3-stage cyclic processes such as agricultural operations, manufacturing workflows, and business cycles. Emphasizes the role of each stage and their interconnections to enhance audience comprehension. The warm orange and yellow color palette is particularly suited for agriculture, natural resources, and sustainability-focused presentations.
-
How to Use
Double-click the text fields within each circular node to edit stage names and descriptions according to your content. Add detailed explanations in the text areas below each node. To modify colors, select the node and adjust the shape fill options in the formatting menu. All elements are fully editable and can be repositioned as needed.
-
Recommended For
Agricultural and livestock company operational planning presentations, manufacturing process explanations, business cycle training sessions, environmental and sustainability project reports, consulting proposal methodology sections. Suitable for professionals across all levels and departments who need to communicate cyclic processes and workflows.
-
Slide Structure
Slide 1 features a dark brown background with three orange-to-yellow gradient circular nodes arranged clockwise, each containing an icon, text label, and description area. Slide 2 presents the same 3-stage circular structure on a light gray background using brown and green tones, providing an alternative color scheme for different presentation contexts.
Related Products
-

Project Facility System Diagram – Efficient Operation Planning
#Business Strategy #Operational Plan #Diagram
-

Detailed Architectural Design Steps – Flow with Modern Touch
#Product/Service Introduction #Business Strategy #Operational Plan
-

Visualizing Product Development Planning Process with Diagram Slide
#Business Strategy #Operational Plan #Diagram
-

Flow of Chemical Experiment Steps - Linear Process Explanation
#Operational Plan #Diagram #Production and Technology Development Strategy
