Eco Business Expected Effects Diagram
RM0800002_19
- Last Update 02/27/2025
- File Size 13.9MB
- # of Slides 2
- File Format PPTX
- Slide Ratio 16:9
- Color
Keywords
- #Content-Based Slides
- #Design-Based Slides
- #Business Strategy
- #Market and Competitor Analysis
- #Diagram
- #Financial Outlook & Expected Impact
- #Future Outlook
- #Cluster
- #Closed Cluster Diagram
- #16:9
- #closed-form cluster diagram PowerPoint
- #overlapping areas diagram slide
- #eco business effects presentation
- #business strategy diagram template
- #revenue projection PowerPoint slide
About the Product
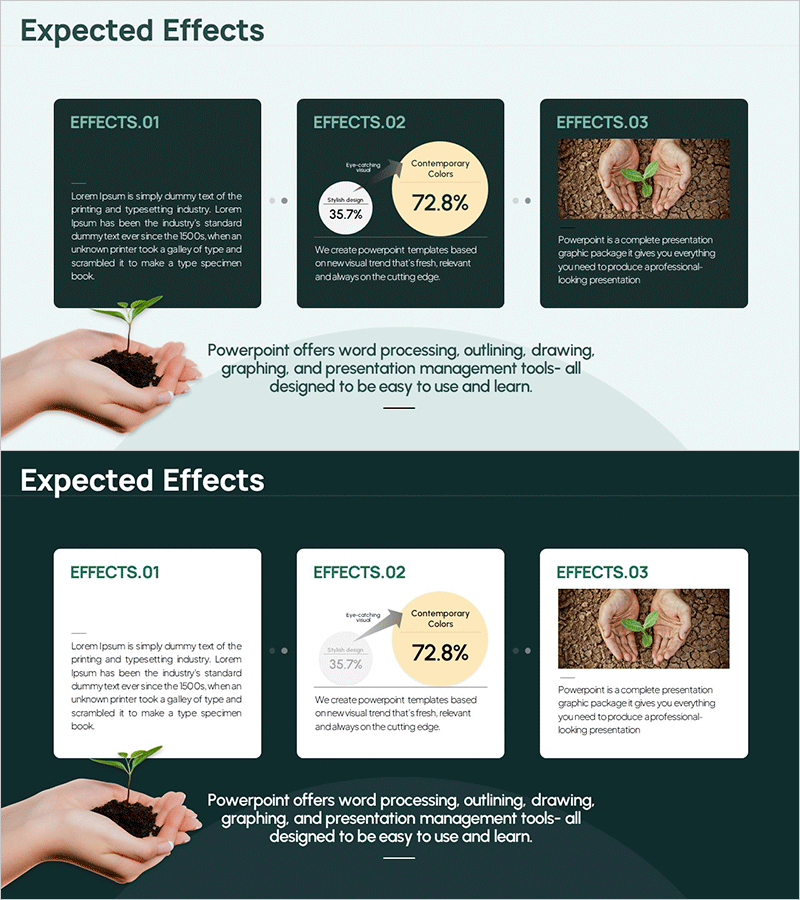
A closed-form cluster diagram PowerPoint slide that visually represents the expected effects of eco business initiatives. The design features three overlapping areas centered around a core concept, creating a hierarchical structure that emphasizes interconnected outcomes. Set against a dark green background with cream-colored accent zones and a real-world image of hands holding a seedling, the slide reinforces environmental messaging. Quantitative data (35.7%, 72.8%) and descriptive text are balanced to convey both numerical and qualitative information effectively. The 2-slide set offers multiple background options (light and dark), optimized for 16:9 widescreen presentation formats.
Usage Points
-
Main Usage
Use this slide to explain the multifaceted expected effects of new business ventures or environmental projects. The overlapping three-area structure emphasizes interconnectedness, while the combination of quantitative metrics and qualitative descriptions enhances audience comprehension and engagement.
-
How to Use
Ideal for business proposals, investor pitch decks, and strategic management presentations where you need to articulate anticipated project outcomes. Fully editable text and data fields allow customization to match your specific initiative. Choose between light or dark background versions depending on your presentation environment and design preferences.
-
Recommended For
New business development teams, sustainability officers, marketing strategists, executive reporting managers, and investor relations professionals. Particularly effective for communicating the impact of ESG, environmental responsibility, and social impact projects with persuasive visual clarity.
-
Slide Structure
Two-slide set, each featuring a central core concept surrounded by three overlapping closed-form cluster areas. Labels 'EFFECTS.01', 'EFFECTS.02', and 'EFFECTS.03' identify each section, with text descriptions and percentage data positioned within respective zones. A seedling-in-hands image on the left reinforces environmental messaging. Formatted in 16:9 widescreen to align with contemporary presentation standards.
Related Products
-

Visualizing the Changing Trend of the Ageing Population with a 100% Stacked Bar Graph
#Business Strategy #Market and Competitor Analysis #Marketing Plan and Strategy
-

Abstract Pattern Presentation Line Chart – Visualizing Business Strategies
#Business Strategy #Market and Competitor Analysis #Graph
-

Comparison Graph Before and After Growth – Business Insights
#Business Strategy #Market and Competitor Analysis #Graph
-

IT Service Future Outlook and Expected Effects Graph – Analyzing Impact
#Business Strategy #Market and Competitor Analysis #Graph
