Future Outlook Vertical Bar Graph – Business Strategy Analysis
RJ0500005_6
- Last Update 06/08/2025
- File Size 0.2MB
- # of Slides 2
- File Format PPTX
- Slide Ratio 16:9
- Color
Keywords
- #Content-Based Slides
- #Design-Based Slides
- #Business Strategy
- #Market and Competitor Analysis
- #Graph
- #Financial Outlook & Expected Impact
- #Future Outlook
- #Column
- #Column Chart
- #16:9
- #vertical bar chart PowerPoint
- #bar graph slide template
- #business outlook analysis
- #data comparison chart
- #financial presentation slide
About the Product
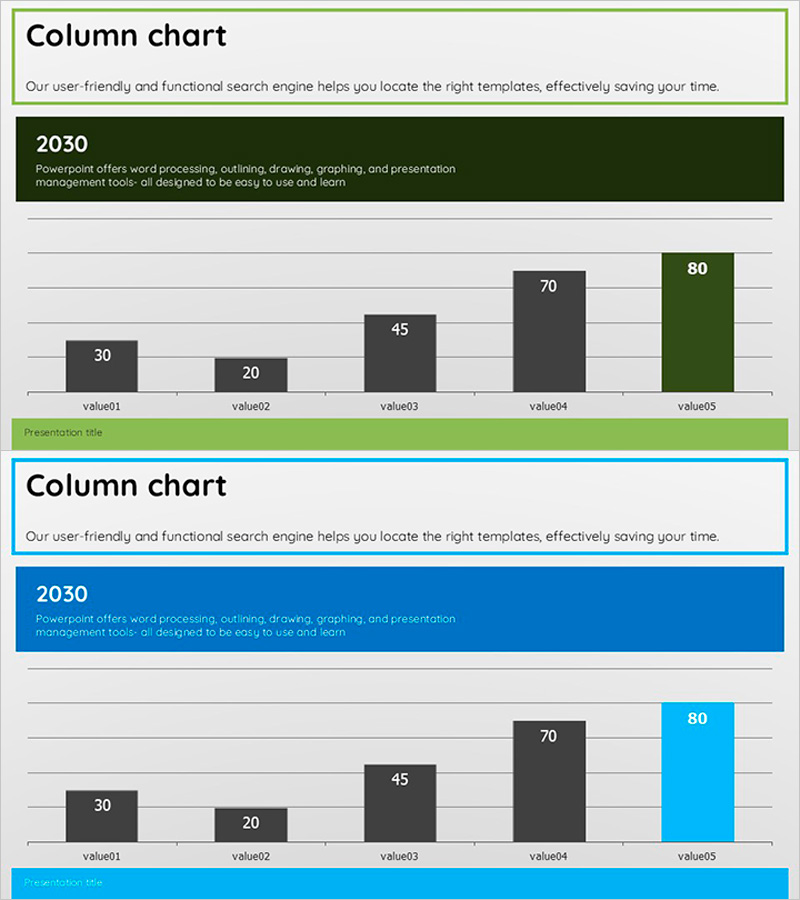
A vertical bar chart PowerPoint slide designed to visualize business strategy analysis and future outlook. This presentation template effectively compares five data points using a dark gray and accent color scheme (green and blue) to emphasize key metrics. The 16:9 widescreen format with 2 slides is ready to use for market analysis, revenue forecasting, business strategy presentations, and financial reports.
Usage Points
-
Main Usage
This slide is optimized for comparing and communicating numerical data such as business strategy analysis, market forecasts, and revenue projections. The five-item bar chart allows viewers to instantly compare values, making it ideal for executive briefings, investor presentations, and strategic planning meetings.
-
How to Use
Edit the bar heights and numerical labels with your own data. The accent colors (green and blue) draw attention to the most important metrics. Customize the title and descriptive text to match your presentation context. Both slide variations provide flexibility for different reporting scenarios.
-
Recommended For
Executives, financial analysts, marketing strategists, and business development professionals can use this template for management reports, business plans, investor pitch decks, and quarterly performance reviews. It is particularly effective for data-driven decision-making meetings where numerical credibility is essential.
-
Slide Structure
Two-slide set with dark green header on the first slide displaying year information and descriptive text, followed by five vertical bars (value01 to value05) in gray, dark gray, and accent colors. The second slide features an identical structure with a blue header and accent color variation, providing flexibility for different presentation contexts.
Related Products
-

Orange & Green Future Outlook Bar Graph
#Business Strategy #Market and Competitor Analysis #Graph
-

Utilization Rate of Oriental Medicine Clinics by Age – Market and Competitor Analysis
#Business Strategy #Market and Competitor Analysis #Graph
-

Growth Prospects Graph – Business Strategy Development
#Business Strategy #Market and Competitor Analysis #Graph
-

Soccer Illustration and Vertical Bar Graph – Market Analysis and Business Strategy Product
#Business Strategy #Market and Competitor Analysis #Graph
