Mapping the Flow of Key Components – Multidirectional Service Operations
RB0800023_18
- Last Update 03/22/2025
- File Size 7.4MB
- # of Slides 2
- File Format PPTX
- Slide Ratio 4:3
- Color
Keywords
- #Content-Based Slides
- #Design-Based Slides
- #Technical Approach
- #Diagram
- #Service Operation Plan
- #System Architecture Diagram
- #Flow
- #Structure
- #Multidirectional Flow
- #Tree Diagram
- #4:3
- #radial diagram PowerPoint
- #multidirectional structure slide
- #service operations diagram
- #flow structure template
- #diagram PowerPoint slide design
About the Product
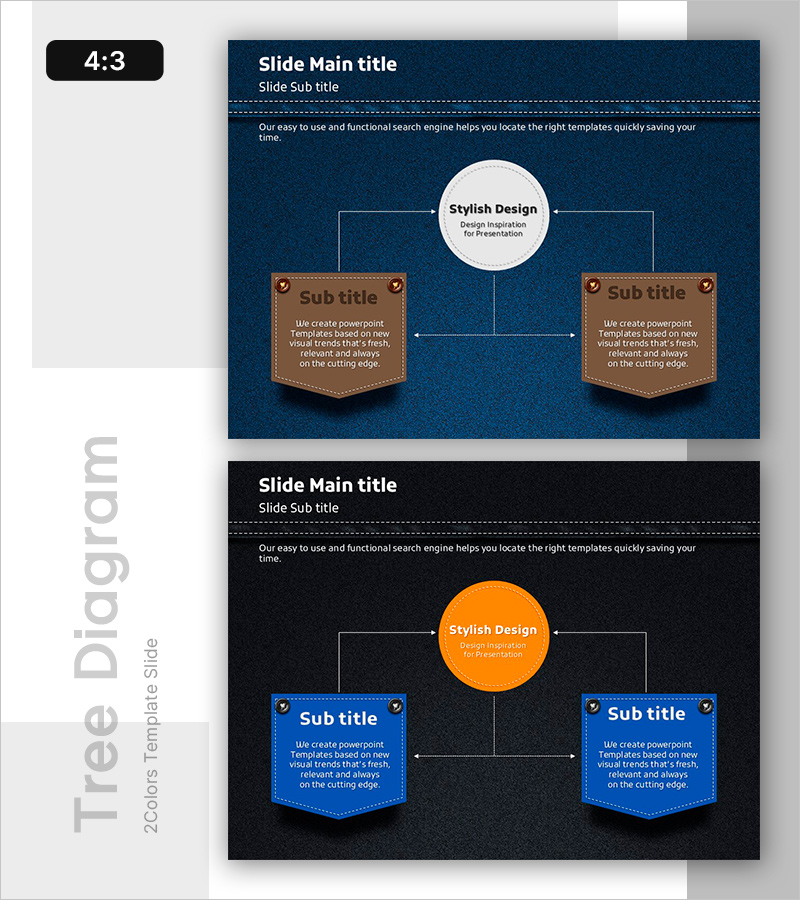
A radial diagram PowerPoint slide with a central hub expanding into three directional branches for service operations visualization. Set against a dark blue background, the design features a white circular center node connected via arrows to three banner-shaped input areas in brown and blue tones. This 2-slide deck includes color variations (brown version and blue version) in 4:3 ratio PPTX format, ready for immediate editing. Clearly defined text input zones make it ideal for presentations, business plans, and reports requiring multidirectional relationship mapping.
Usage Points
-
Main Usage
This radial diagram visualizes a central concept connected to three or more related elements simultaneously. Ideal for mapping service operations, organizational hierarchies, process flows, and strategic initiatives where center-to-periphery relationships need clear visual representation.
-
How to Use
Enter your core concept (e.g., service name, department, process) in the central white circle. Add supporting details in the three banner-shaped boxes on the left, right, and bottom. Arrow connectors automatically show relationships, enabling step-by-step presentation flow.
-
Recommended For
Business strategy presentations, service operation plans, organizational structure explanations, process improvement proposals, marketing strategy pitches, investor pitch decks, executive reports, and consulting proposals across industries.
-
Slide Structure
2-slide set featuring Slide 1 with brown banner version and Slide 2 with blue banner version. Each slide contains 4 text input areas: 1 central white circle + 3 banner-shaped boxes (left, right, bottom) connected by dotted arrow lines, creating a clear radial hierarchy.
Related Products
-

Square Frame Presentation Template – Risk Management Diagram
#Operational Plan #Technical Approach #Diagram
-

Delivering Service Operation Plans with Mobile Network Configuration Diagram
#Technical Approach #Diagram #Service Operation Plan
-

Service Execution and Operation Plan Diagram Slide - Pink and Bluegreen Harmony
#Technical Approach #Diagram #Service Operation Plan
-

System Configuration Organizational Chart Diagram – Visual Tool for Service Development
#Business Management #Technical Approach #Diagram
