Service Development Item Classification Diagram – Efficient Business Management
RM0200009_20
- Last Update 02/03/2025
- File Size 0.6MB
- # of Slides 2
- File Format PPTX
- Slide Ratio 16:9
- Color
Keywords
- #Content-Based Slides
- #Design-Based Slides
- #Business Management
- #Technical Approach
- #Diagram
- #Service Development Plan
- #System Architecture Diagram
- #Flow
- #Cluster
- #Multidirectional Flow
- #Chain Diagram
- #16:9
- #connection diagram PowerPoint
- #3-step process slide
- #service development diagram
- #business management flowchart
- #how to create process diagram in PowerPoint
About the Product
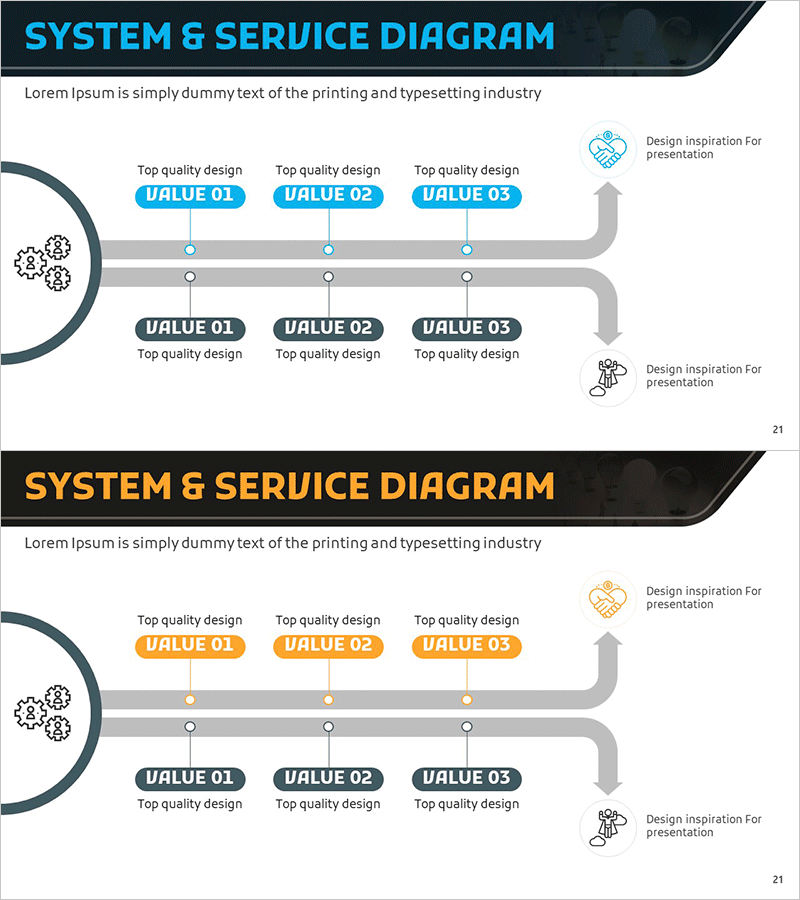
A PowerPoint slide that classifies and connects service development items across three stages. The flow originates from a gear icon on the left, passes through three VALUE boxes at the top, and connects to three detailed items at the bottom, making it ideal for business management and process explanation presentations. This slide deck is ready to use for system architecture, service development phases, and workflow diagrams in PowerPoint presentations. Two slide variations are provided in blue and orange color schemes, allowing you to match your presentation's tone and style.
Usage Points
-
Main Usage
Clearly visualizes service development stages and item classification relationships. The flow starting from a gear icon passes through three VALUE boxes and connects to detailed items below, transforming complex business processes into simple, intuitive visual representations.
-
How to Use
Use in company profile presentations for business structure explanation, proposal decks for service development processes, and business plans for phased implementation strategies. Edit the VALUE box labels and bottom item text to match your specific service or product classification.
-
Recommended For
Business managers, product planners, consultants, and marketing professionals explaining service development stages or workflow processes. Particularly effective for presentations emphasizing hierarchical relationships among three key items.
-
Slide Structure
Two-slide set. Each slide features a left-side gear icon, center connecting lines, three blue/orange VALUE boxes at the top, and three dark boxes at the bottom. Connection lines and arrows clearly show the flow, with icons and text areas fully editable.
Related Products
-

Service Development Plan Strengths & Weaknesses
#Business Management #Technical Approach #Diagram
-

Financial Services System Diagram - Innovative Service Development
#Business Management #Technical Approach #Diagram
-

Introduction to Business Services – System and Service Diagram
#Business Management #Technical Approach #Diagram
-

Future Technology System Configuration Diagram – Efficient Development Flow
#Business Management #Technical Approach #Diagram
