Horizontal Bar Chart for Skincare Market Sales Status
RJ0800008_19
- Last Update 08/01/2025
- File Size 0.6MB
- # of Slides 2
- File Format PPTX
- Slide Ratio 16:9
- Color
Keywords
- #Content-Based Slides
- #Design-Based Slides
- #Business Strategy
- #Financial Plans and Performance
- #Graph
- #Financial Outlook & Expected Impact
- #Sales and Revenue
- #Column
- #Segmented Column
- #16:9
- #vertical bar chart PowerPoint
- #bar graph slide template
- #sales trend visualization
- #5-year comparison chart
- #PowerPoint chart slide design
About the Product
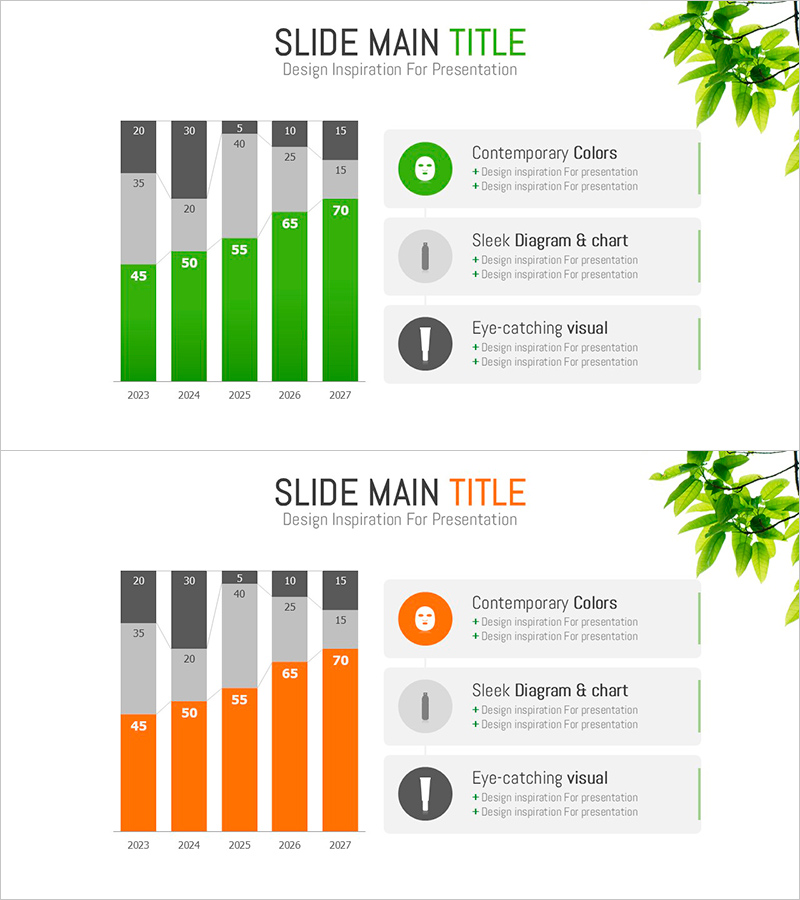
A vertical bar chart PowerPoint slide visualizing 5-year sales trends from 2023 to 2027. Available in two color schemes—vibrant green and orange—allowing flexible presentation options for the same dataset. Each year displays key metrics (45, 50, 55, 65, 70) with cumulative data represented by gray bars at the top. The right side features three key insights with circular icons and descriptive text areas for supplementary information. This slide deck is ready to use for business strategy presentations, financial planning reports, market analysis, and performance reviews.
Usage Points
-
Main Usage
This slide presents time-series data such as annual revenue, sales volume, or growth rates across five years using vertical bar comparison. Bar heights intuitively represent each year's metrics, while gray cumulative bars provide broader context. Ideal for business performance reports, market analysis presentations, and financial results announcements.
-
How to Use
Edit the bar heights and numerical values to match your dataset. Select either the green or orange color version based on your presentation theme. Customize the right-side text area with key insights or strategic points. Adjust cumulative data sections as needed to convey multi-layered information effectively.
-
Recommended For
Finance teams, marketing departments, and executives preparing performance reports. Suitable for quarterly and annual results presentations, business planning sessions, investor relations (IR) materials, market analysis reports, and any scenario requiring data-driven persuasive communication.
-
Slide Structure
Two-slide layout: first slide features green-toned vertical bar chart (5 years with cumulative data), second slide presents the same structure in orange tones. Both slides include three circular icons with descriptive text areas on the right. Formatted in 16:9 widescreen ratio for optimal display in modern presentation environments.
Related Products
-

Internet Business Analysis Graph - Powerful Data Visualization
#Company Introduction #Business Strategy #Graph
-

Horizontal Bar Chart Visualizing Herb Tea Sales Trends
#Market and Competitor Analysis #Financial Plans and Performance #Graph
-

(Orange & Green) Bundle Chart and Future Outlook
#Business Strategy #Financial Plans and Performance #Graph
-

Effectively Visualized Slide of Business Trends
#Business Introduction #Business Strategy #Diagram
