Gradient Vertical Bar Graph for Market Analysis – Innovation and Growth
RJ0300060_21
- Last Update 05/04/2025
- File Size 0.1MB
- # of Slides 2
- File Format PPTX
- Slide Ratio 16:9
- Color
Keywords
- #Content-Based Slides
- #Design-Based Slides
- #Market and Competitor Analysis
- #Graph
- #Competitor Analysis
- #Market Analysis
- #Column
- #Grouped Column
- #16:9
- #vertical bar chart PowerPoint
- #gradient chart template
- #data comparison slide
- #market analysis graph
- #bar graph PowerPoint template
- #numerical data visualization
- #how to create bar chart in PowerPoint
About the Product
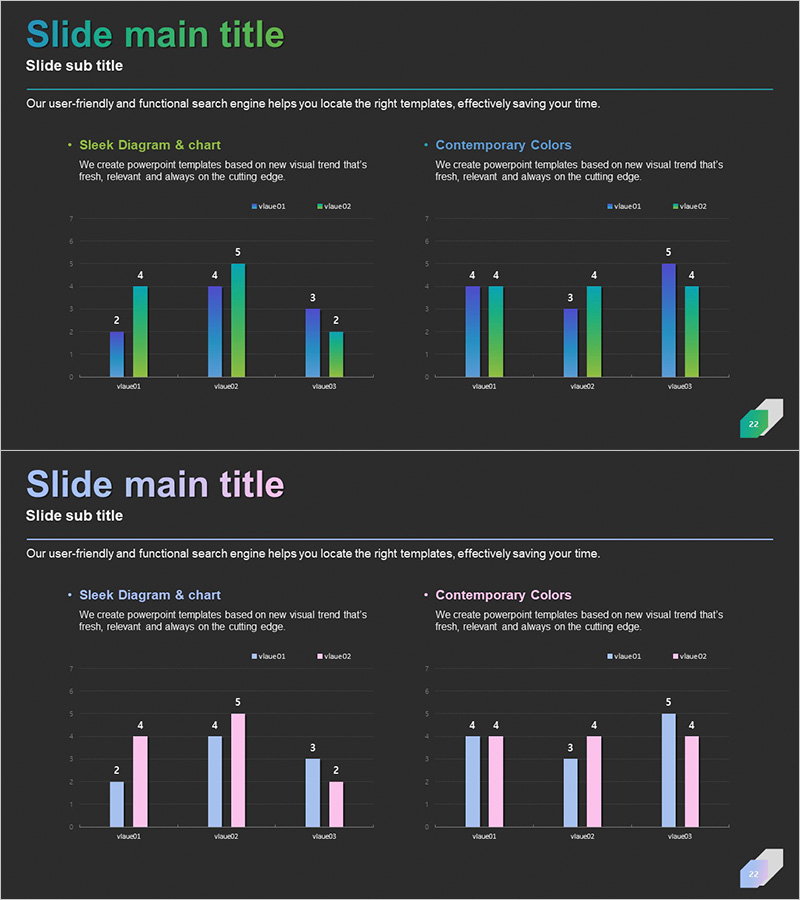
A professional vertical bar chart PowerPoint slide optimized for market analysis and competitive comparison. Features gradient color combinations in blue, green, and pink tones across two distinct chart layouts, each displaying three-item numerical comparisons. The 2-slide deck is formatted for 16:9 widescreen presentation and ready for immediate use in market trends, revenue analysis, customer satisfaction metrics, and performance benchmarking. Each bar is aligned with legend labels for easy editing and data customization. The gradient effect adds visual hierarchy while maintaining clarity for quantitative data presentation.
Usage Points
-
Main Usage
Presents quantitative data through clear side-by-side comparison of multiple metrics. Ideal for market size analysis, revenue reporting, customer satisfaction scores, and product performance benchmarking. The gradient coloring creates visual distinction between data series while maintaining professional appearance.
-
How to Use
Double-click bar heights and legend text to input actual numerical values. Color schemes can remain as-is or be adjusted via theme colors for brand consistency. Update title and subtitle areas with your analysis topic (market analysis, competitive comparison, etc.), then add supporting insights in the description text area.
-
Recommended For
Marketing professionals, sales analysts, business executives, market research specialists, and investment pitch presenters. Recommended for quarterly performance reviews, strategic planning meetings, investor presentations, and data-driven business proposals requiring quantitative evidence.
-
Slide Structure
2-slide layout with independent chart sections. Each slide contains title and subtitle areas plus two separate vertical bar chart zones. Left chart uses blue-green gradient palette; right chart uses blue-pink gradient palette. Both charts display three data points (value01, value02, value03) with corresponding legend labels for clear numerical comparison.
Related Products
-

Grouped Bar Chart for Learning Categories
#Market and Competitor Analysis #Graph #Competitor Analysis
-

Marketing and Analysis Presentation Template – Professional Data Visualization Design
#Market and Competitor Analysis #Graph #Competitor Analysis
-

Vertical Bar Chart for Future Growth Prediction – Innovative Vision
#Market and Competitor Analysis #Graph #Competitor Analysis
-

Table chart & Clustered Column Graph – Market Analysis & Competitor Comparison
#Market and Competitor Analysis #Diagram #Graph
