Core Technology Cycle Diagram – Innovation and Strategy
RM0700004_11
- Last Update 02/26/2025
- File Size 0.7MB
- # of Slides 2
- File Format PPTX
- Slide Ratio 16:9
- Color
Keywords
- #Content-Based Slides
- #Design-Based Slides
- #Product/Service Introduction
- #Business Vision and Strategy
- #Diagram
- #Features
- #Core Competencies
- #Flow
- #Circular Flow
- #16:9
- #circular diagram PowerPoint
- #technology cycle slide template
- #5-step cycle diagram
- #how to create cycle diagram in PowerPoint
- #product introduction presentation slide
About the Product
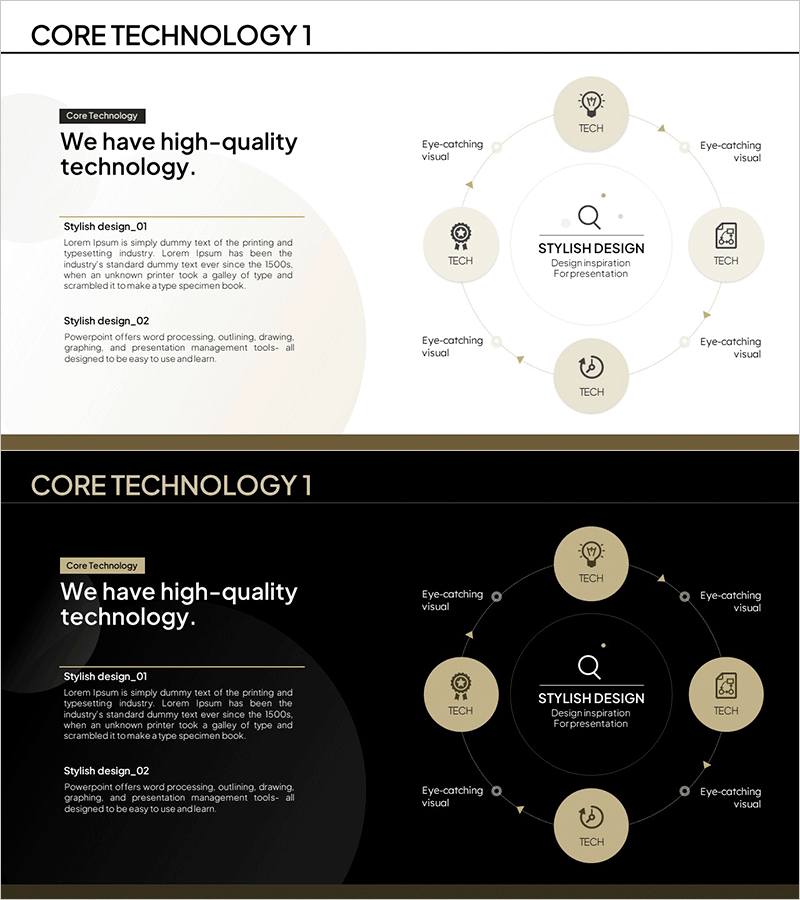
A PowerPoint slide expressing core technology's circular structure through five interconnected nodes. This radial cycle diagram features a central search icon surrounded by technology elements positioned at cardinal points, optimized for innovation strategy, product development, and business vision presentations. Beige-toned circular nodes connected by brown arrows intuitively convey the cyclical relationship of technological processes. The two-slide set (light background and dark background) adapts to various presentation environments, with fully editable text and icons for customization.
Usage Points
-
Main Usage
Visualizes technology innovation processes, product development cycles, and cyclical business strategy relationships. The radial structure radiates from a central core concept through five technology elements, making it ideal for technology company product introductions, business vision statements, and strategic presentations.
-
How to Use
Replace each node's icon and text with specific technology element names. The central search icon can be substituted with core technology, strategy, or vision concepts while maintaining arrow direction and node placement to emphasize circular flow. Use the light background for daytime presentations and the dark background for evening events or video backgrounds.
-
Recommended For
Recommended for technology company product introduction presentations, technology innovation sections in business plans and strategy documents, technology competitiveness explanations in investor pitch decks, and process cycle structure explanations in seminars and training materials. Ideal for technology managers, planners, and marketing professionals who need to communicate complex technology cycles in a simple, intuitive manner.
-
Slide Structure
Two-slide set. Each slide features a central search icon surrounded by five beige-toned circular nodes positioned at cardinal points, connected by brown arrows in clockwise circular flow. Each node contains a technology icon and text input area, with a central 'STYLISH DESIGN' label and description zone. First slide has light beige background; second slide features dark background for contrast and versatility.
Related Products
-

Core Competency Cycle Diagram – Flow of Strategy and Vision
#Product/Service Introduction #Business Vision and Strategy #Diagram
-

Hexagonal Solid Overlapping Diagram – Business Vision and Strategies
#Product/Service Introduction #Business Vision and Strategy #Diagram
-

Key Core Competency Circular Diagram – Business Vision and Strategy
#Product/Service Introduction #Business Vision and Strategy #Diagram
-

Visualize Business Vision and Strategy with Puzzle Donut Diagram
#Product/Service Introduction #Business Vision and Strategy #Diagram
