Core Competency Cycle Diagram – Flow of Strategy and Vision
RM0300012_9
- Last Update 02/10/2025
- File Size 5MB
- # of Slides 2
- File Format PPTX
- Slide Ratio 16:9
- Color
Keywords
- #Content-Based Slides
- #Design-Based Slides
- #Product/Service Introduction
- #Business Vision and Strategy
- #Diagram
- #Graph
- #Features
- #Core Competencies
- #Flow
- #Circles
- #Circular Flow
- #Doughnut Chart
- #16:9
- #circular diagram PowerPoint
- #4-stage cycle diagram
- #core competency slide template
- #business process flow diagram
- #strategy cycle PowerPoint slide
About the Product
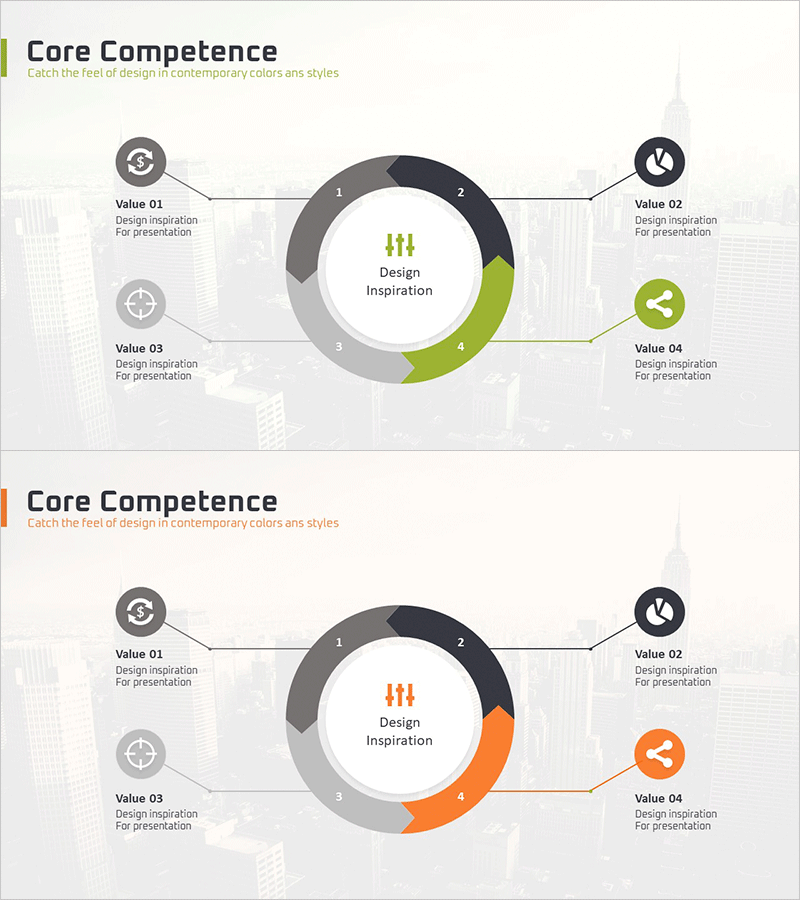
A PowerPoint slide that visualizes organizational core competencies through a 4-stage circular diagram structure. The central donut chart features gray, dark navy, and green segments with icons and text areas at each stage. Ideal for expressing cyclical processes such as strategy, vision, execution, and performance in business presentations, executive reports, and organizational capability briefs. The 2-slide set includes color variations (green and orange) that can be customized to match your brand palette.
Usage Points
-
Main Usage
Visualize organizational core competencies, strategy, and vision through a cyclical process framework for executive reports, organizational briefings, and strategic presentations. Emphasizes interdependencies and continuous improvement cycles.
-
How to Use
Input stage names (e.g., Strategy, Execution, Performance, Improvement) into the 4 donut segments, and add detailed content to the 4 external icon nodes connected by lines. Select either green or orange version to align with corporate branding.
-
Recommended For
Executive teams, strategy departments, organizational development teams for internal reports, employee training materials, investor presentations, and consulting proposals. Best suited for organizations emphasizing cyclical improvement and continuous growth.
-
Slide Structure
Central donut diagram (4 segments + center text) + 4 external icon nodes (connected by lines) + background cityscape image. 16:9 aspect ratio with 2 slides (green and orange color variations).
Related Products
-

Core Technology Cycle Diagram – Innovation and Strategy
#Product/Service Introduction #Business Vision and Strategy #Diagram
-

Business Strategy Core Diagram – Efficient and Visual Structure
#Product/Service Introduction #Business Vision and Strategy #Diagram
-

Core Triangle Connection Diagram – Business Vision and Marketing Strategy
#Business Vision and Strategy #Marketing Plan and Strategy #Diagram
-

Visually Appealing Company Introduction PowerPoint Template
#Company Introduction #Product/Service Introduction #Business Vision and Strategy
