Corporate Risk Management Structure Diagram
RM0700003_21
- Last Update 02/26/2025
- File Size 1.1MB
- # of Slides 2
- File Format PPTX
- Slide Ratio 16:9
- Color
Keywords
About the Product
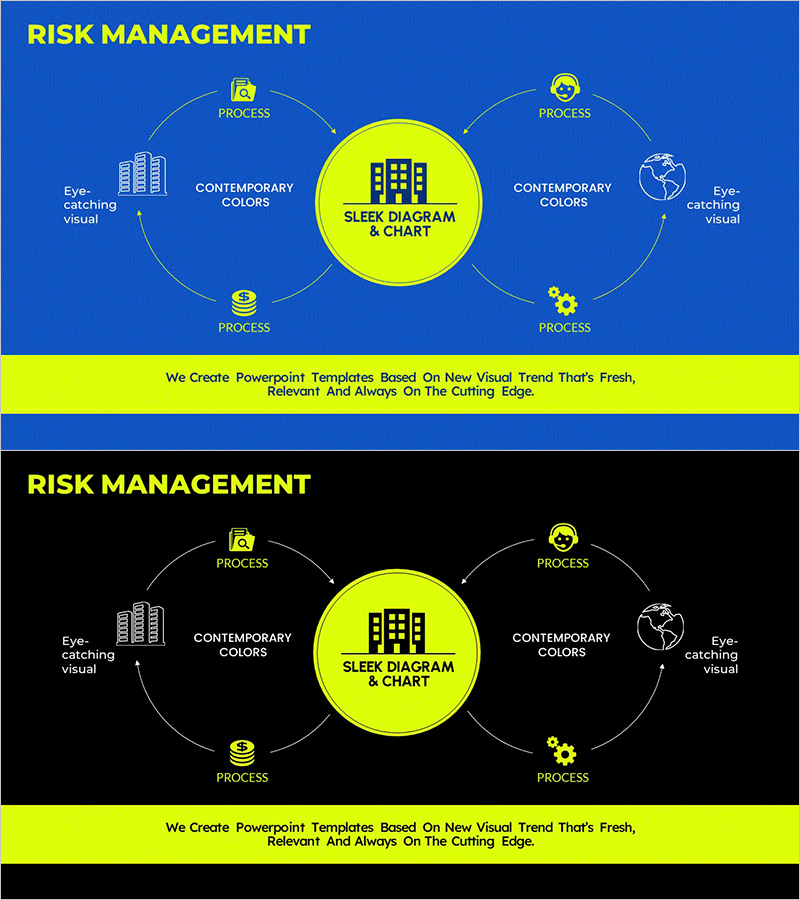
A PowerPoint slide that visualizes your organization's risk management process through a 4-stage circular flow structure. Arrows radiate outward from a bright yellow central circle in four directions, each labeled with Process icons and contemporary design elements. The dark blue background with yellow accent colors creates a modern, eye-catching visual presentation. Two slide versions are included—one with a blue background and one with a black background—allowing you to select the best fit for your presentation environment. This slide effectively communicates cyclical risk management systems including identification, analysis, assessment, and response phases.
Usage Points
-
Main Usage
Visualizes your organization's risk management process through a circular structure, clearly communicating the continuous management cycle from risk identification through response. The four-stage connection using arrows emphasizes the cyclical improvement process.
-
How to Use
Use in executive risk reports, risk management policy presentations, internal control system briefings, business continuity planning meetings, and governance discussions. Select either the blue or black background version based on your presentation environment and audience.
-
Recommended For
Risk management officers, audit committees, internal audit teams, executives, compliance departments, and governance professionals explaining risk management frameworks. Particularly valuable in finance, manufacturing, construction, and other risk-sensitive industries for raising organizational risk awareness.
-
Slide Structure
Four directional arrows (top, bottom, left, right) radiate from a central bright yellow circle. Each arrow endpoint features a process icon (camera, building, coin, globe) with 'Process' and 'Contemporary Colors' labels, flanked by 'Eye-catching visual' text on both sides. Both slides maintain identical structure with only background color variation.
Related Products
-

Interior Template Circulation Diagram - Target Market Strategy
#Marketing Plan and Strategy #Diagram #Target Market Strategy
-

Interior Quotation and Construction System – Harmonizing Design and Operations
#Operational Plan #Diagram #Business Processes
-

Two-arrow Rotation Diagram – Operational Planning and Risk Management
#Operational Plan #Technical Approach #Diagram
-

Watercolor Distribution Strategy Circulation Diagram – Effective Expression for Marketing
#Technical Approach #Marketing Plan and Strategy #Diagram
