Circular Diagram for Research – Visual Flow
RJ0500007_12
- Last Update 06/09/2025
- File Size 1.2MB
- # of Slides 2
- File Format PPTX
- Slide Ratio 16:9
- Color
Keywords
- #Content-Based Slides
- #Design-Based Slides
- #Product/Service Introduction
- #Operational Plan
- #Diagram
- #Differentiation Strategy for Products/Services
- #Risk Management
- #Flow
- #Circular Flow
- #16:9
- #circular diagram PowerPoint
- #3-step cycle slide
- #circular process presentation
- #feedback loop diagram
- #business cycle flow PPT
About the Product
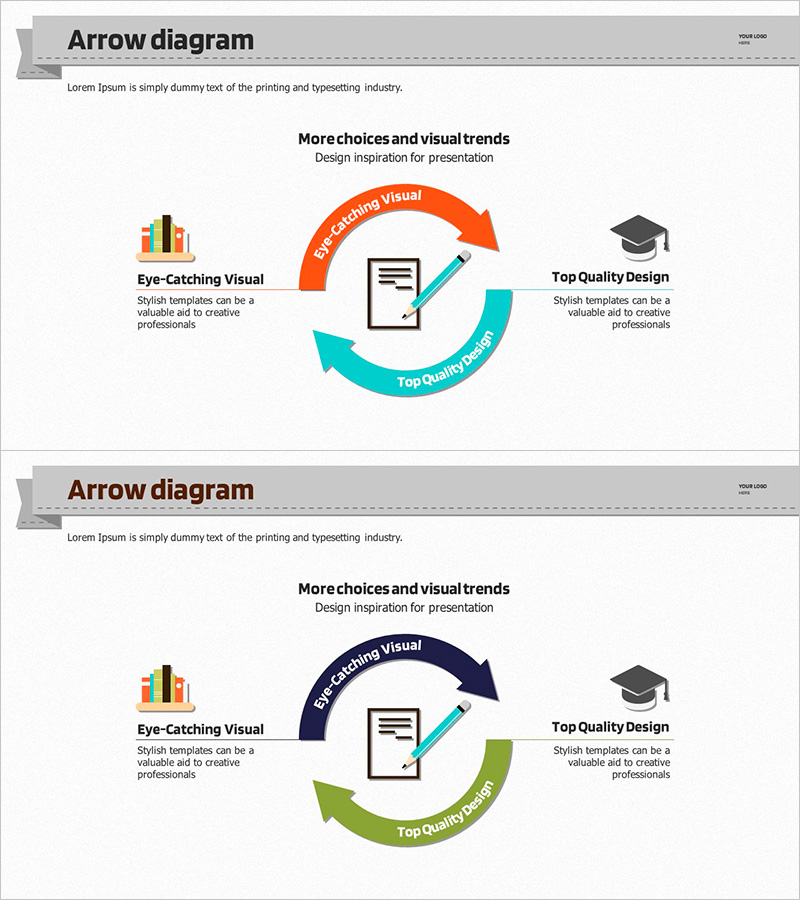
A 3-step circular diagram PowerPoint slide designed to visually communicate research findings and business processes. Orange and teal curved arrows flow clockwise around a central element, effectively illustrating repetitive cycles, feedback loops, and continuous improvement processes. Each stage includes dedicated space for icons and descriptive text, making it immediately applicable to research presentations, business reports, and educational materials. Delivered as 2 slides in 16:9 widescreen format, fully editable in all PowerPoint versions.
Usage Points
-
Main Usage
Clearly visualizes repetitive research processes, business cycles, continuous improvement loops, and feedback mechanisms through a 3-step circular structure. The flow around a central concept enhances audience comprehension of cyclical workflows and iterative systems.
-
How to Use
Use in research presentations, thesis defenses, business meetings, and strategy sessions when explaining cyclical or repetitive processes. Customize the text and icons for each stage to represent organizational cycles, product development loops, customer journey cycles, or quality improvement frameworks.
-
Recommended For
Ideal for researchers, students, business analysts, project managers, and marketing professionals presenting repetitive processes or circular structures. Particularly suited for discussions of quality improvement, continuous innovation, and cycle-based operational models.
-
Slide Structure
Central hub with core concept icons (document and pen) surrounded by 3 curved arrows (orange, teal, green) flowing clockwise. Each arrow segment contains stage labels and text areas. Supporting icons (bar chart, graduation cap) positioned on left, right, and top for visual balance and context.
Related Products
-

Camping Product Quality Assurance Plan Slide
#Operational Plan #Diagram #Business Processes
-

Visualizing Business Strategy with Four Color Arrow Diagram
#Product/Service Introduction #Business Vision and Strategy #Diagram
-

Airplane Circulation Diagram – Efficient Operation Planning
#Operational Plan #Technical Approach #Diagram
-

Reuse Cycle Diagram Slide – Sustainability and Social Responsibility
#Operational Plan #Corporate Social Responsibility #Diagram
