Square Circulatory System Diagram – Enhancing Operational Efficiency
RJ0500007_26
- Last Update 06/09/2025
- File Size 1.2MB
- # of Slides 2
- File Format PPTX
- Slide Ratio 16:9
- Color
Keywords
About the Product
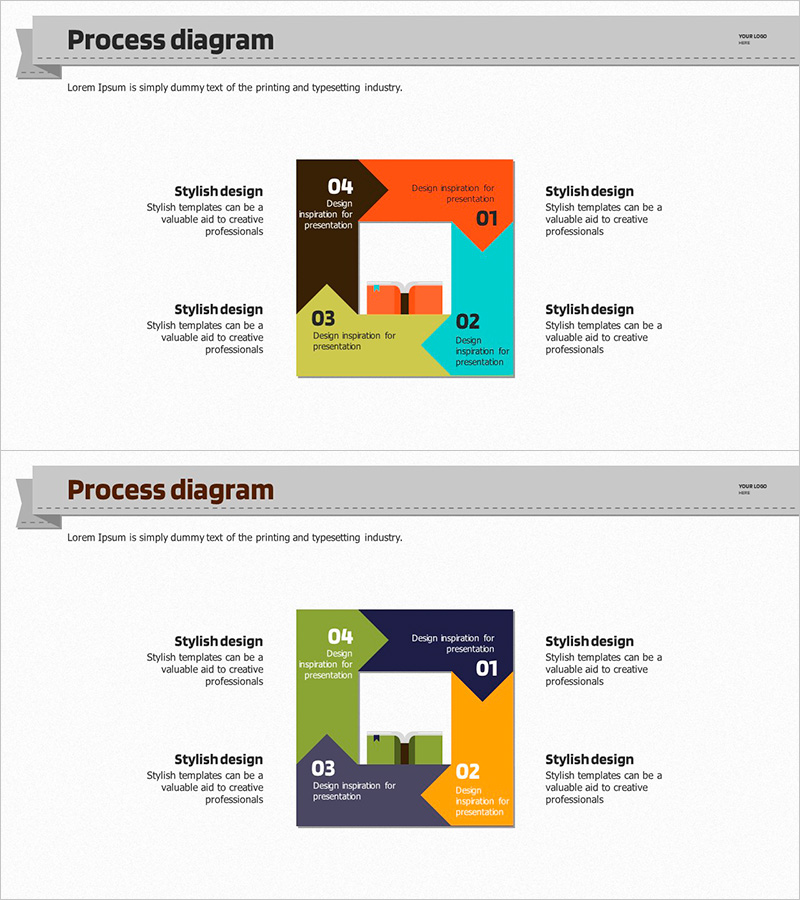
A 4-node circular diagram PowerPoint slide with distinct color coding in orange, cyan, yellow, and brown. The central square box anchors a clockwise flow pattern, making it ideal for presenting cyclical processes, operational efficiency improvements, and risk management frameworks. The left and right text areas accommodate detailed descriptions for each stage. This 2-slide set in 16:9 widescreen format is ready for immediate editing and presentation use.
Usage Points
-
Main Usage
Designed to clearly represent cyclical processes, repeating workflows, and iterative systems across four distinct stages. Perfect for illustrating operational improvement cycles, quality management loops, continuous improvement frameworks, and risk management processes.
-
How to Use
Enter stage names in each numbered node (01–04) and add detailed explanations in the left and right text areas. Colors can be retained or customized to match corporate branding. Insert logos or key terms in the central box as needed.
-
Recommended For
Ideal for executives, team leads, and project managers presenting process improvements, operational frameworks, and management cycles. Applicable across manufacturing, services, IT, finance, and other industries requiring workflow visualization.
-
Slide Structure
Four nodes positioned clockwise around a central square box, each identified by number and distinct color. Left and right text input zones provide space for stage-specific descriptions and supporting details.
Related Products
-

Interactive Gear Flow Presentation Template – Simplifying Complex Business Strategies
#Operational Plan #Diagram #Business Processes
-

Business Process Visualization Diagram Slide
#Operational Plan #Technical Approach #Diagram
-

Reuse Cycle Diagram Slide – Sustainability and Social Responsibility
#Operational Plan #Corporate Social Responsibility #Diagram
-

Development Plan Cycle Diagram – Efficient Workflow
#Product/Service Introduction #Operational Plan #Diagram
