Introduction Effect Share Graph - Visualizing Business Success
RM0700003_20
- Last Update 02/26/2025
- File Size 29.1MB
- # of Slides 4
- File Format PPTX
- Slide Ratio 16:9
- Color
Keywords
- #Content-Based Slides
- #Design-Based Slides
- #Business Strategy
- #Market and Competitor Analysis
- #Graph
- #Financial Outlook & Expected Impact
- #Market Share
- #Other
- #Area Chart
- #16:9
- #area chart PowerPoint
- #introduction effect slides
- #market share visualization
- #business performance graph
- #area graph template download
About the Product
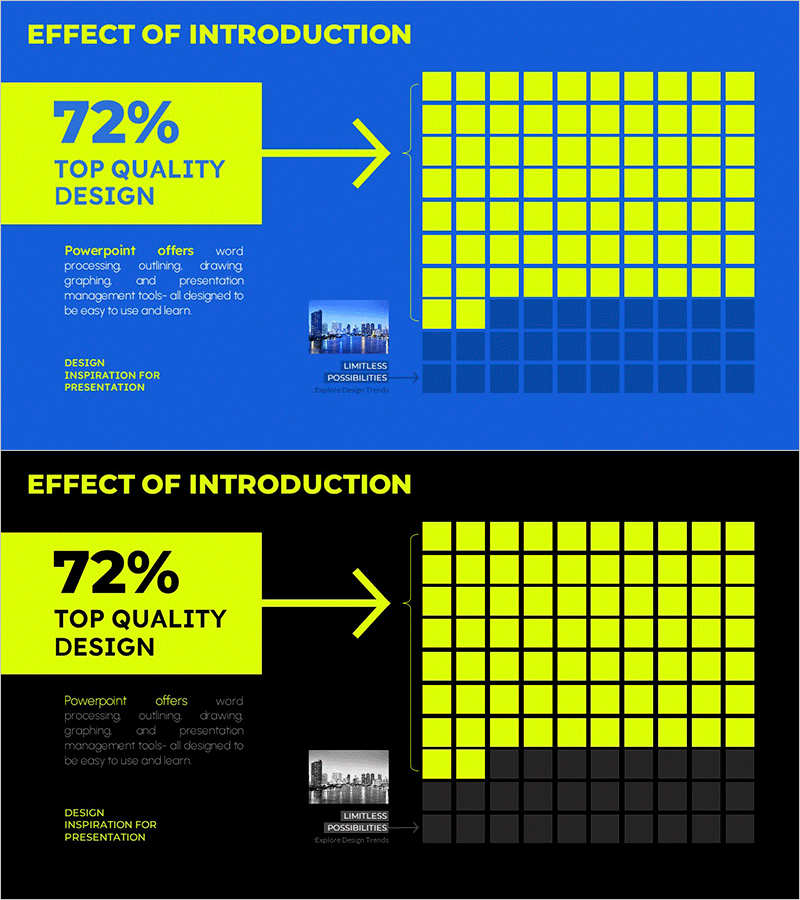
A PowerPoint slide set that visualizes introduction effects and market share using area charts with transparent blue and yellow regions. This 4-slide collection clearly displays business performance and strategic outcomes before and after implementation. Each slide effectively compares adoption impact through overlapping transparent areas, making it ideal for executive presentations and investor pitches. Designed in 16:9 widescreen format and provided as fully editable PPTX files for immediate customization and deployment.
Usage Points
-
Main Usage
Clearly express product adoption effects, market share changes, and business performance comparisons using area charts. Overlapping transparent regions show before-and-after differences, enabling intuitive communication of growth trends in executive reports and investor presentations to emphasize business impact.
-
How to Use
Input actual introduction effect metrics and market share data into each slide's area chart. Blue regions represent baseline conditions while yellow regions show post-implementation results, with overlapping areas visually highlighting changes. Add text boxes and arrows to explain key achievements, and adjust area colors to match corporate branding guidelines.
-
Recommended For
Ideal for new business initiative result reports, product adoption impact analysis, market share change explanations, and business performance presentations. Suitable for executive reports, investor relations materials, business plan performance sections, marketing strategy market analysis, consulting reports, and academic presentations.
-
Slide Structure
Four slides featuring area charts with transparent blue and yellow regions. Each slide includes an 'Introduction Effect' title with '72% Top Quality Design' emphasis at the top, overlapping area chart in the center, and descriptive text with cityscape imagery at the bottom. Designed in 16:9 widescreen format optimized for modern presentation environments.
Related Products
-

Stereographic Area Graph for Data Analysis and Market Outlook
#Business Strategy #Market and Competitor Analysis #Graph
-

Sensuous Cloud Presentation Template Area Chart – Business Strategy
#Business Strategy #Graph #Financial Outlook & Expected Impact
-

Area Chart for Market Share Analysis – Global Business PowerPoint Template
#Market and Competitor Analysis #Graph #Market Share
-

Analyzing Market Share with Donut Chart – Clean and Stylish Design
#Company Introduction #Market and Competitor Analysis #Graph
